

- Home
- >
- FX Daily Forecasts
- >
- AUD/USD: Levels of resistance – possible downgrade

AUD/USD: Levels of resistance - possible downgrade
Rating:

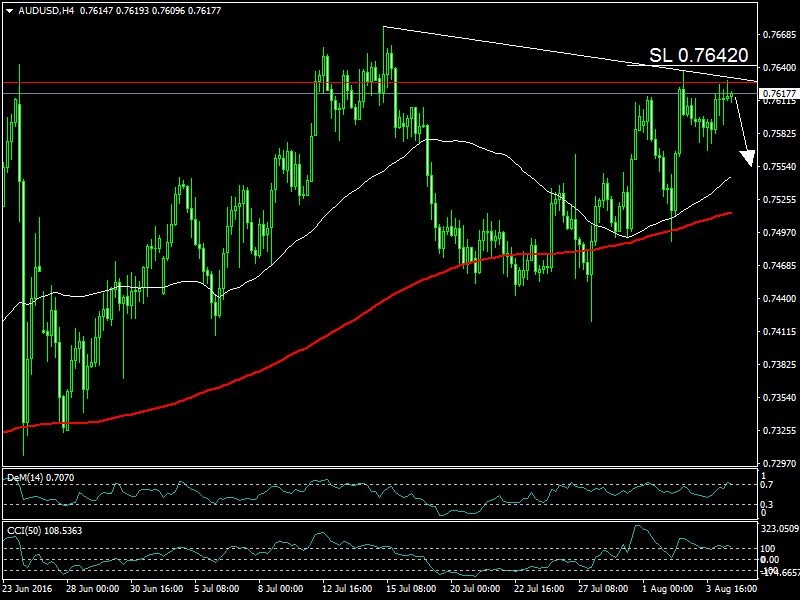
AUD / USD: 4 hour chart
Price on horizontal and diagonal resistances
Price action: pin-bar on levels of resistance, the possibility of forming "double top" - a negative signal
indicators:
50/200 MA: not yet give a signal for trend reversals
DeM: rotates zone over-bought market - possible reversal of the price downwards
CCI (50) in an area of over-bought market - a negative signal
SL: 0.76420
Alternative scenario: If the price crosses above the horizontal resistance is possible new increasing of the price to new levels of resistance.
Jr_Trader_I_Ivanov
 Varchev Traders
RECCOMEND
WAS THIS POST USEFUL FOR YOU?
If you think, we can improve that section,
please comment. Your oppinion is imortant for us.
If you think, we can improve that section,
please comment. Your oppinion is imortant for us.

