

- Home
- >
- FX Daily Forecasts
- >
- AUD / USD: Opportunities to Sell

AUD / USD: Opportunities to Sell
Rating:

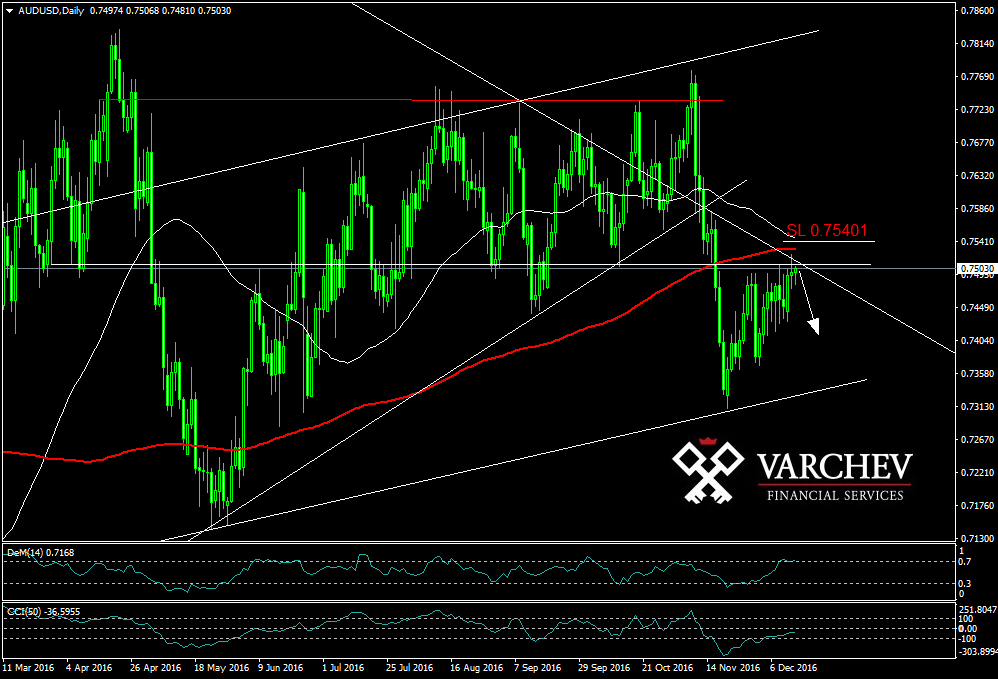
AUD / USD: Daily chart - choppy
Price on daily horizontal and weekly diagonal resistance
Price Action: Dodge and false breakout of horizontal resistance - probably drop
indicators:
50 / 200MA: 50 indicates the intersection 200 - if 50 passes 200 is a negative signal
DEM: bit over then 0.7 - possible downgrade
CCI (50) below 0 - a negative signal
SL: 0,75401
Sentiment: Today we expect an increase of interest rates in US. If the Fed raise interest rates this should support the dollar and to have a negative impact on risk appetite.
Alternative scenario: If the price crosses over 200MA is possible to see a new bullish momentum.
Jr_Trader_I_Ivanov
 Varchev Traders
 Read more:


RECCOMEND
WAS THIS POST USEFUL FOR YOU?
If you think, we can improve that section,
please comment. Your oppinion is imortant for us.
If you think, we can improve that section,
please comment. Your oppinion is imortant for us.

