

- Home
- >
- FX Daily Forecasts
- >
- Short signal on NZD/USD

Short signal on NZD/USD
Rating:

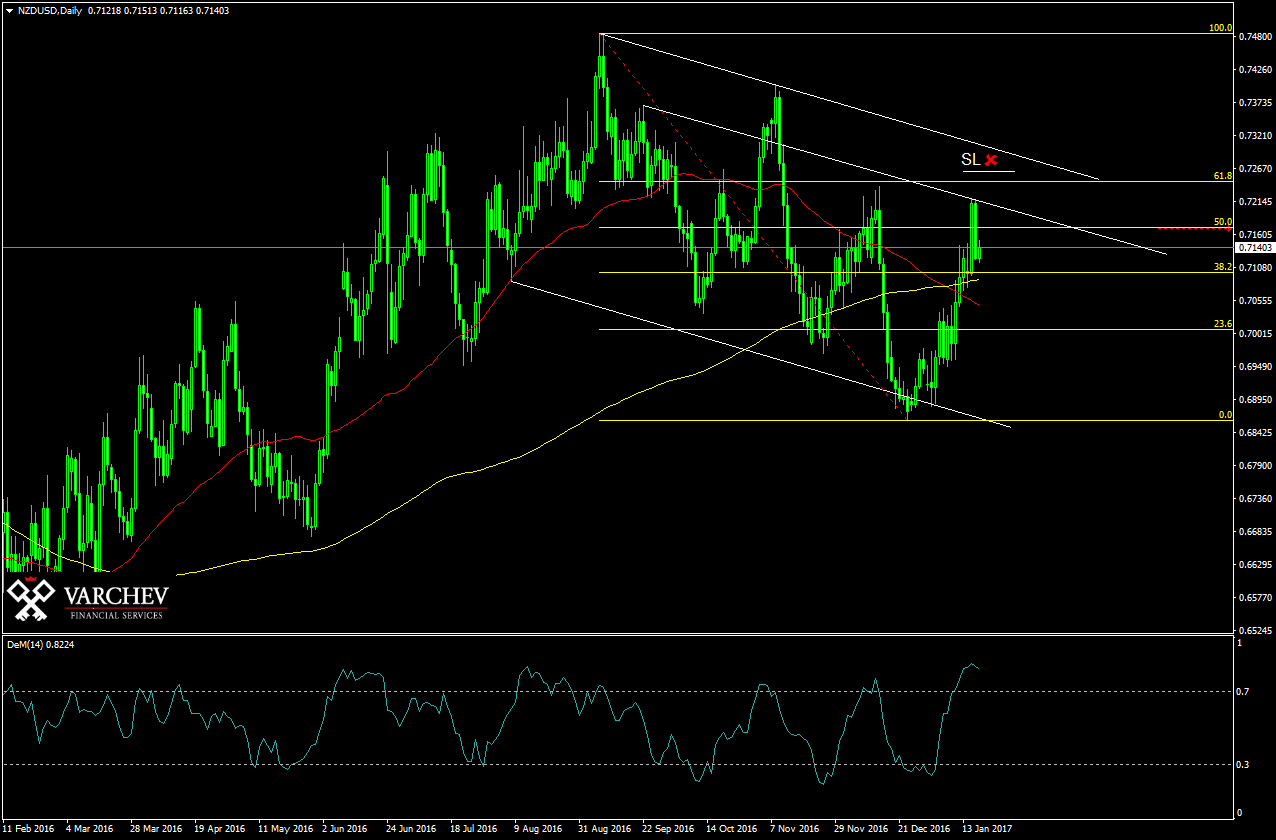
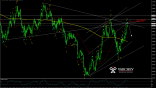
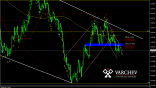
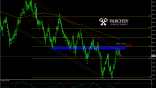
Instrument: NZD/USD
Graphics: D1
Long- and medium-term downtrend correction to 50% of Fibonacci and levels of horizontal resistance.
Price action: The price formed two reversal bar of the level of horizontal resistance and 50% Fibonacci - a negative signal.
Indicators:
Dem (14): Located in overbought zone above 0.7 and rotated - a negative signal
SMA: 50 below the 200 SMA - a negative signal.
It is better to wait for price adjustment upward to position themselves better in the market and increase the coefficient of risk profit.
SL: over the last two vertices and 61.8 Fibo at a price 0.7260
Alternative scenario: If the price remain permanently above 50% Fibonacci destroy the negative trend in the price.
Trainee P_Milanov
 Varchev Traders
 Read more:
RECCOMEND
WAS THIS POST USEFUL FOR YOU?
If you think, we can improve that section,
please comment. Your oppinion is imortant for us.
If you think, we can improve that section,
please comment. Your oppinion is imortant for us.

