

- Home
- >
- Stocks Daily Forecasts
- >
- ABX.US Opportunity for short selling after a slight correction

ABX.US Opportunity for short selling after a slight correction
Rating:

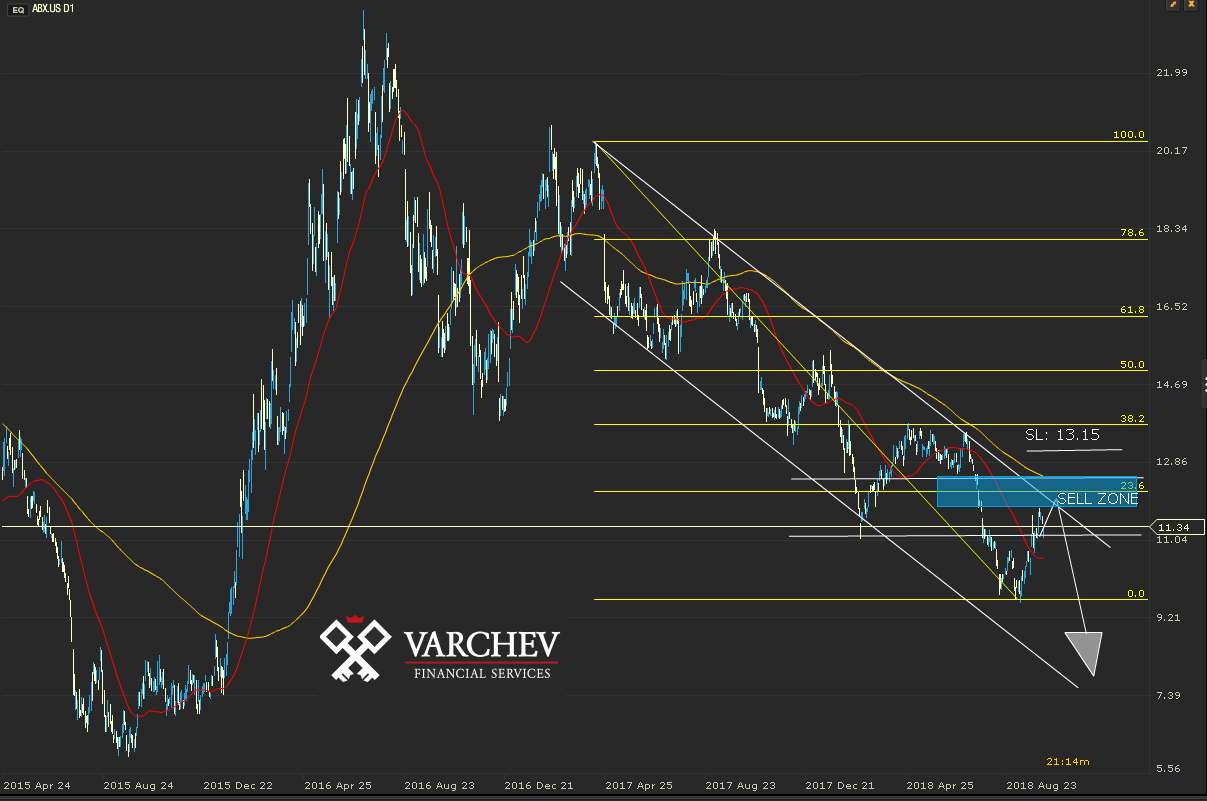
ABX.US Daily Chart Our Expectations: Declining trend, correction close to horizontal and diagonal resistance. Possibility for short positions after slight correction with stop 13.15
Alternative scenario: If the resistors fail to withstand the correction test, and we have a successful break in the levels, we can look for long positions after confirmation by a price action signal.
Comment: Decreasing main trend. The price is in correction territory as it is at levels close to key horizontal and diagonal resistance. 50/200 MA in bearish formation. We wait for the price to enter the BUY ZONE and position the shorts after confirmation of price action. At these levels is also 23.6% Fibonacci on the main movement, which makes them even more significant.
 Trader Aleksandar Kumanov
 Read more:
 US – Iran – Iraq tension remain the main driver of the stock market today
 How top market players on Wall St think 2020 will look like on financial markets
 Money Flow before the start of the new trading week
 Cincinnati Financial Corporation (CINF.US) -Opportunity for long positions
 Asia stocks gain as Fed signals no rate cuts in 2020
If you think, we can improve that section,
please comment. Your oppinion is imortant for us.

