

- Home
- >
- Stocks Daily Forecasts
- >
- Apple forms a triangle formation

Apple forms a triangle formation
Rating:

Apple
Time frame: D1
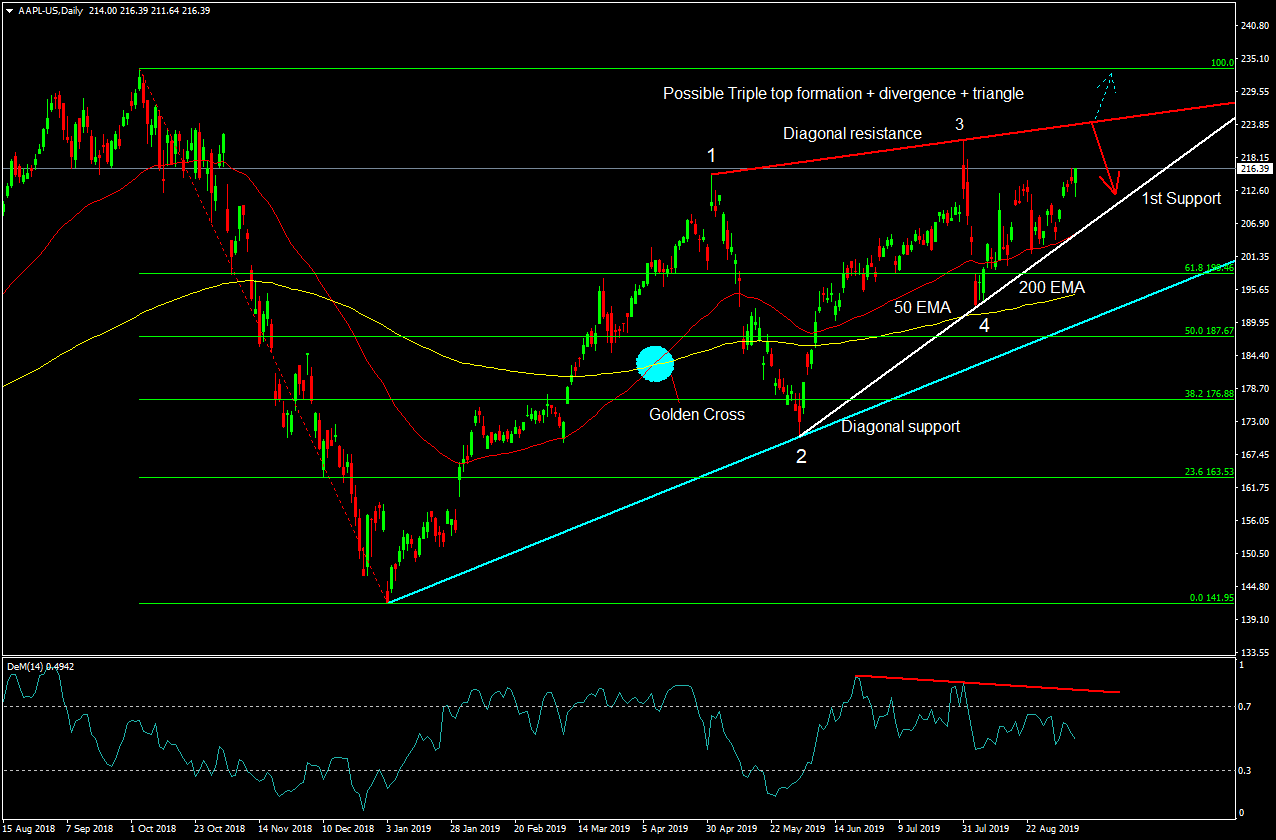
Technical analysis: The chart shows that the stock price is moving in an upward direction. After peaking at $ 215, the price plunged south, reaching $ 170. At that level, she made a bottom and headed north again. With this, the price has entered a triangular consolidation. At the moment, the price has managed to form 4 points and is heading back for the resistance. There are two options when the price reaches the resistance:
Option 1: The price forms a price action formation, which suggests that the resistance is still active and that the downward movement will continue.
Option 2: Price breaks resistance and continues its upward trend.
Indicators: At this stage, 200 and 50 periodic moving averages support the price strongly.
DeM forms a divergence.
 Trader Milko Zashev
 Read more:


If you think, we can improve that section,
please comment. Your oppinion is imortant for us.

