

- Home
- >
- FX Daily Forecasts
- >
- AUD / USD possible short, lower high with pin bar

AUD / USD possible short, lower high with pin bar
Rating:

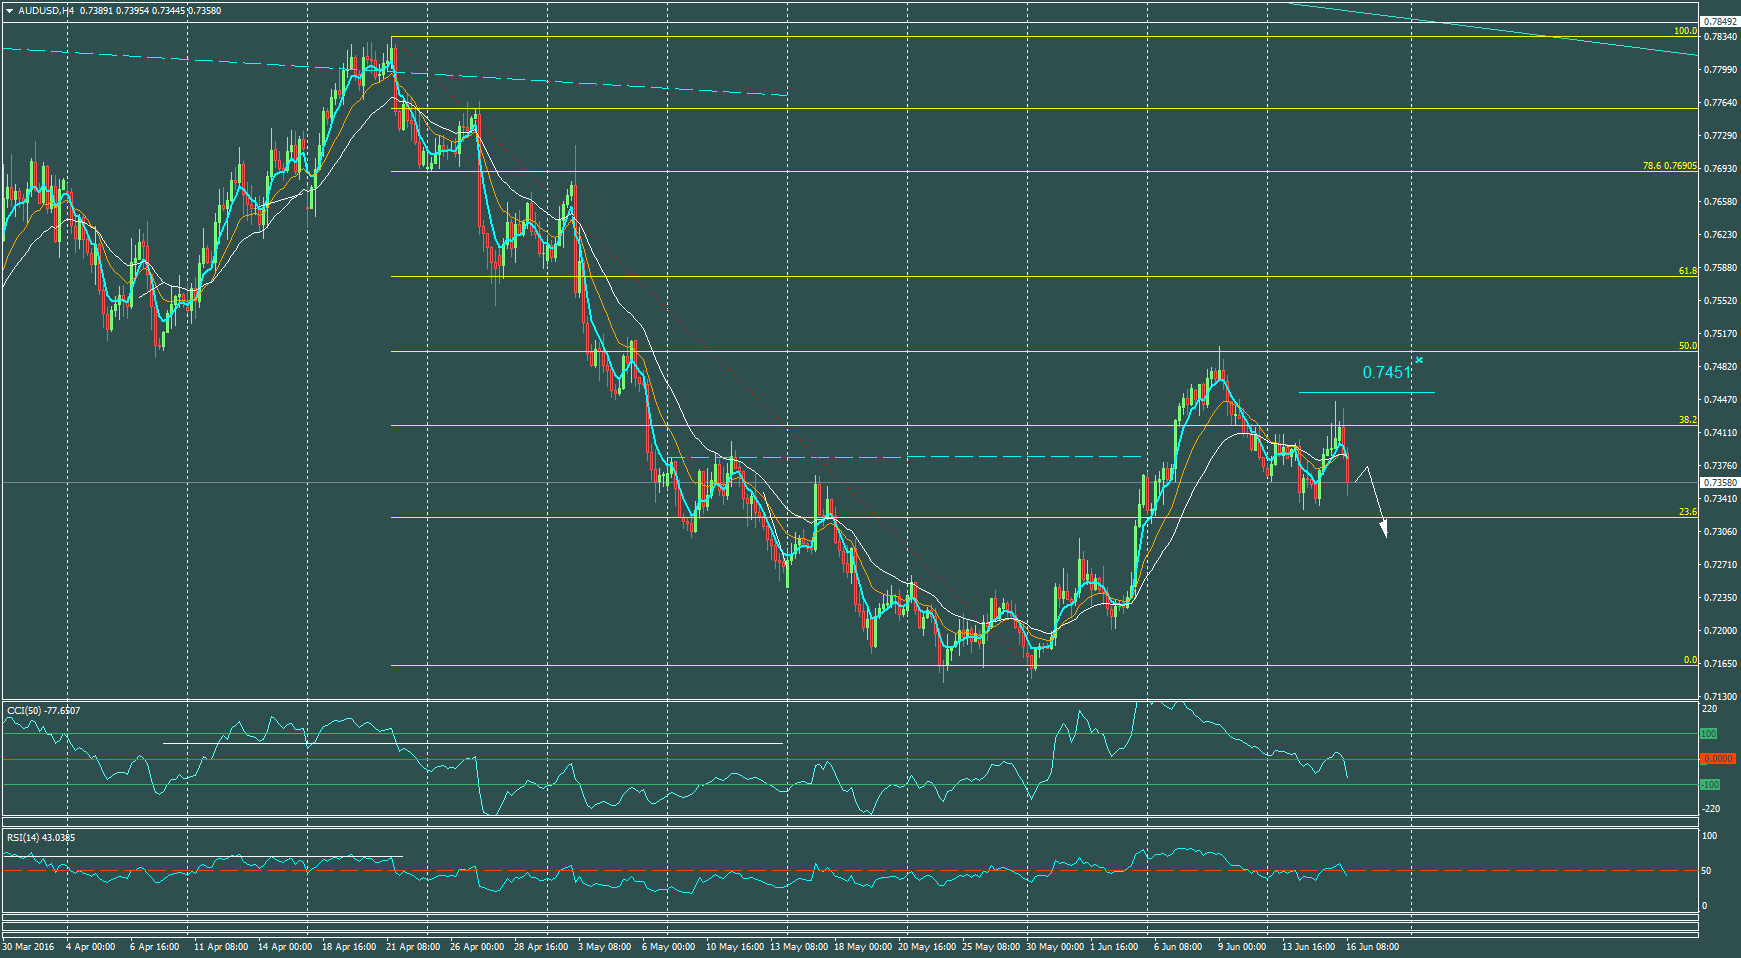
AUD / USD: 4H graph- downward trend and short-term correction
Fibonacci retracement 50% of short - resistance level
Price action: Pin bar to fall
Lower high - negative signal for a downward trend
Second Pin Bar of current high to decline as the price went below the bottom of the Pin Bar.
RSI went below 50, the moment the price went below 25 EMA
CCI(50) went below 0
SL: over the high 0.7451
In order to get better execution its advisable to wait until levels of the price around 0.7370
Stefan D. Angelov - Head of Stocks Trading
 Varchev Traders
 Read more:
 FOREX: Bulls on EURUSD with sight for 1.1300; Основни подкрепи и съпротиви 16.05.2019
 How to trade the AUDJPY breakout
 AUDNZD multiple signals that the bottom is close
 AUD at key technical levels, but the data for China weighs on the fundament
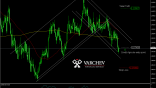 Crédit Agricole with Long recommendation of AUD/NZD – SL: 1.0590 – TP: 1.1050
RECCOMEND
WAS THIS POST USEFUL FOR YOU?
If you think, we can improve that section,
please comment. Your oppinion is imortant for us.
If you think, we can improve that section,
please comment. Your oppinion is imortant for us.

