

- Home
- >
- FX Daily Forecasts
- >
- AUDCAD – long after breakthrough a resistance

AUDCAD - long after breakthrough a resistance
Rating:

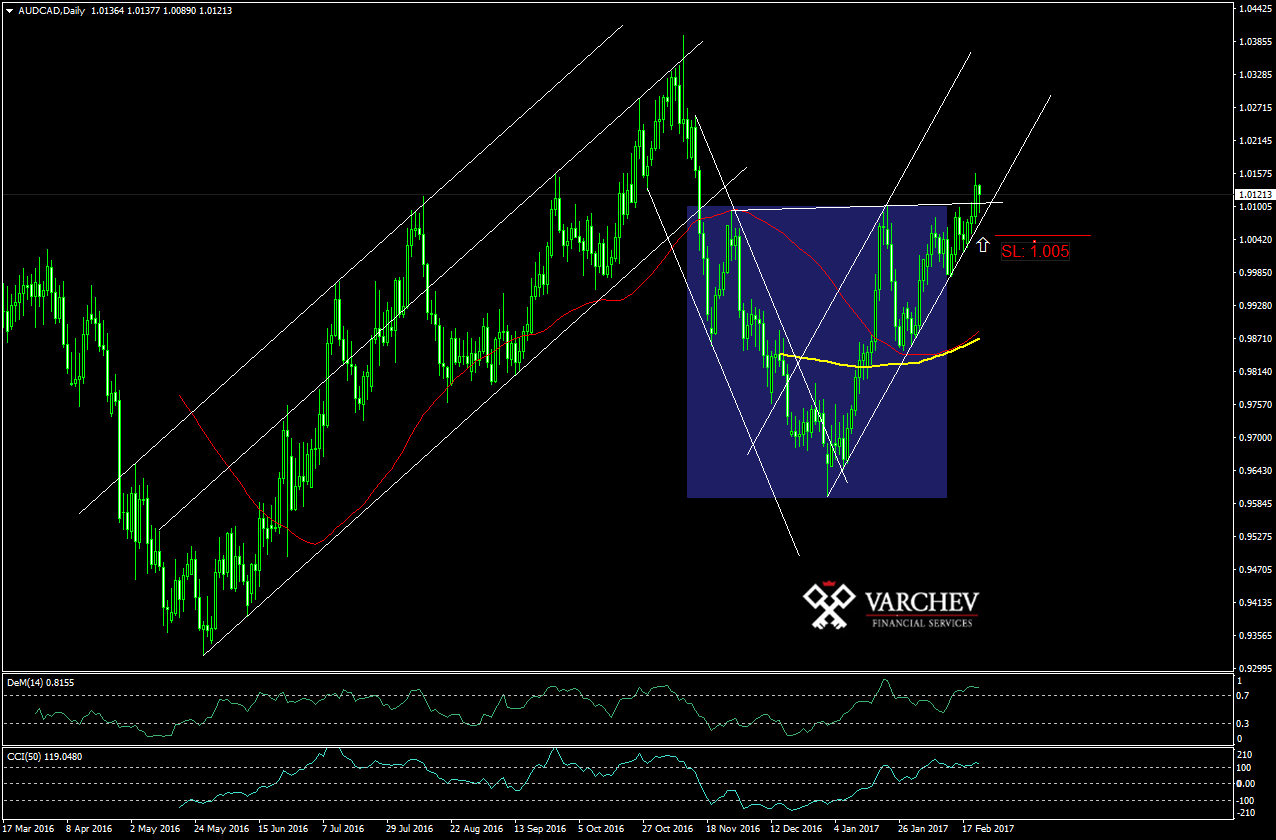
AUDCAD: 23.02.2017
Timeframe: D1
Downtrend movement with correction, forming a trend-confirming H&S figure. Breakthrough the neckline that is horizontal resistance which already became support.
Figure: reversed head & shoulders
Price action: 3 bullish candle bars, last one closed above the resistance
Technical indicators:
SMA50/200 - in positive formation
DeM - turns down above 0.7 - overbought market, that can lead to a short correction
CCI50 - keeps moving above 100 - strong buyers zone
SL: 1.005
Alternative scenario: if price goes back below the neckline support then the positive formation may collapse.
Jr_Trader_Ivan_Ivanov
 Varchev Traders
 Read more:
 FX expiring options today 22.02.2019
 AUD at key technical levels, but the data for China weighs on the fundament
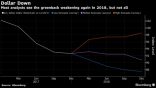 Bloomberg survey expect the negative sentiment for USD to remain in 2018
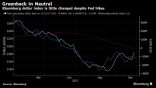 A lack of confidence and the longer-term prospects are holding the dollar back
 Net speculative positions of CFTC as of 19.12.2017
RECCOMEND
WAS THIS POST USEFUL FOR YOU?
If you think, we can improve that section,
please comment. Your oppinion is imortant for us.
If you think, we can improve that section,
please comment. Your oppinion is imortant for us.

