

- Home
- >
- FX Daily Forecasts
- >
- AUD/JPY: Long again after end of a correction

AUD/JPY: Long again after end of a correction
Rating:

AUD/JPY:
Date: 11 January, 2017
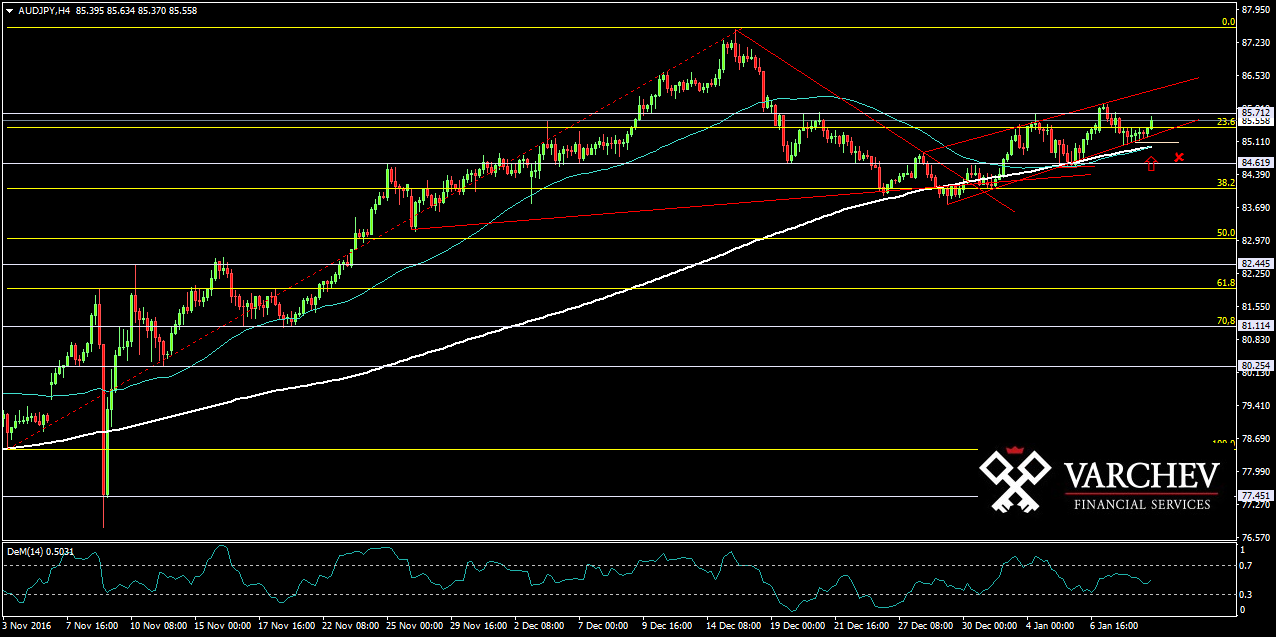
H4 Graph: Long Trend
Price made a correction and entered in a consolidation, but now it seems that the price is ready to continue up. The price action is showing us with higher highs and higher lows. The price was not able to break below the horizontal support and price did remain above the 50/200 ЕМА.
Price Action: 3 doji bars at a level of diagonal support - possible signal for long.
DEM (14) - Still not in a overbought zone and turned up for long.
Alternative scenario: If the price moves down and breaks below the diagonal and horizontal support, will cancel this scenario.
Price for Entry long around: 85.500
SL: 85.00
Jr. Trader - S. Fuchedzhiev
 Varchev Traders
 Read more:


RECCOMEND
WAS THIS POST USEFUL FOR YOU?
If you think, we can improve that section,
please comment. Your oppinion is imortant for us.
If you think, we can improve that section,
please comment. Your oppinion is imortant for us.

