

- Home
- >
- FX Daily Forecasts
- >
- AUD/JPY: New long position is possible close to the diagonal support with the trend

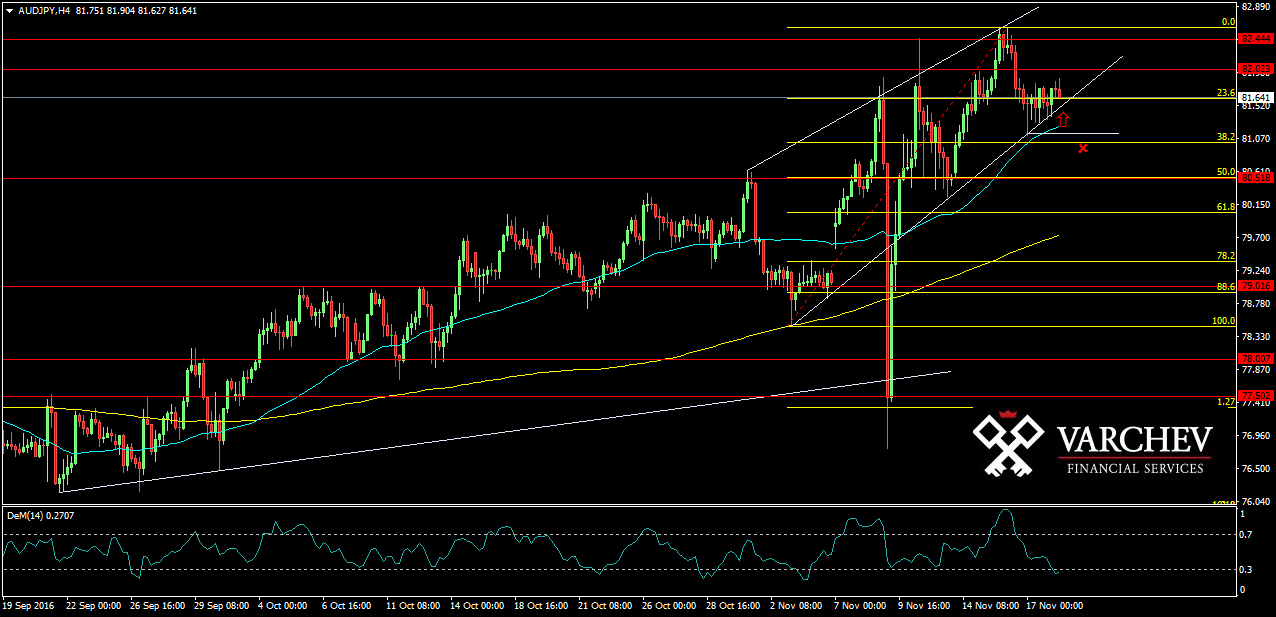
AUD/JPY: New long position is possible close to the diagonal support with the trend
Rating:

AUD/JPY:
Date: 18 November, 2016
H4 Graph: Medium term long
Price is in the lower part of the high visible bullish price channel and price is above the 50 and 200 EMA's. The correction did happen and held Fib 38.2% and here there might be a good place for a new long close the the diagonal support. There is a horizontal support at 81,150. Price makes higher highs and higher lows.
Price Action: Pin bar at horizontal and diagonal support - Possible signal for long.

Alternative scenario: If the price moves lover again and below the diagonal support and below 81,30, this will cancel this scenario.
Technical Indicator:
DEM (14) - In the oversold zone and turned up for long
Price for Entry long around: 81.500
SL: 80.90
Jr. Trader - S. Fuchedzhiev
 Varchev Traders
 Read more:
 And for all the bounty hunters: Iran offers $80m for the head of Donald Trump
 US service member and 2 US Defense Dept contractors killed in Kenya attack
 Iranian Quds leader Qasem Soleimani has been killed – how are markets reacting
 A calm end of an otherwise loud 2019
 Old but Gold – Top 5 posts of Varchev Finance
If you think, we can improve that section,
please comment. Your oppinion is imortant for us.

