

- Home
- >
- FX Daily Forecasts
- >
- AUD/JPY: New short is possible at strong levels of resistance

AUD/JPY: New short is possible at strong levels of resistance
Rating:

AUD/JPY
Date: July 1, 2016
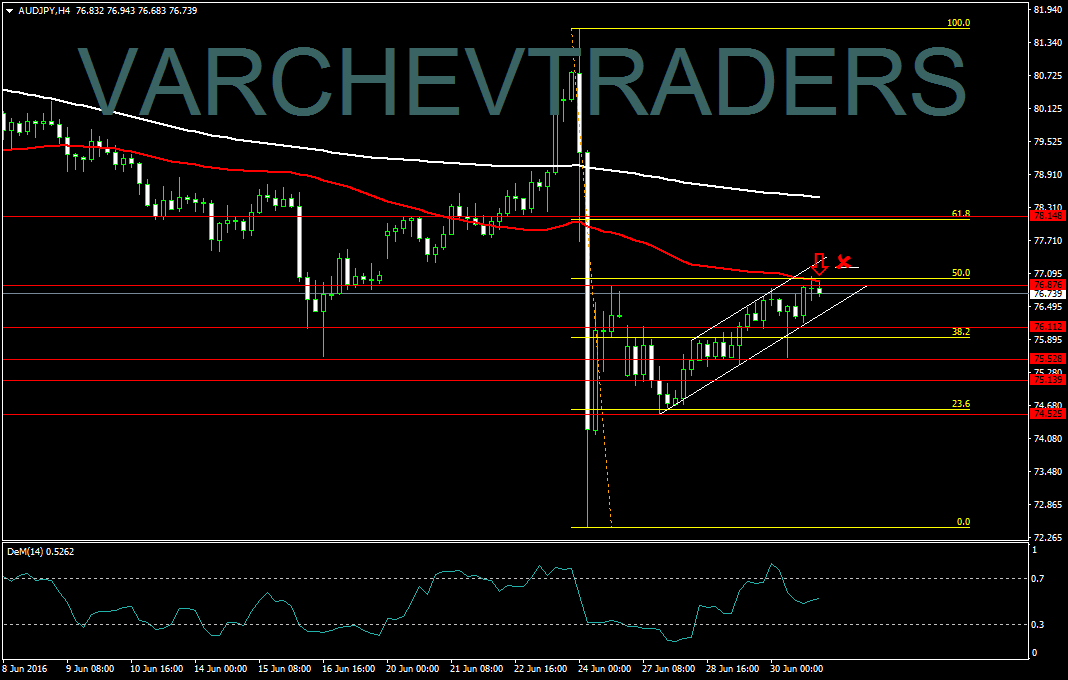
H4 Graph: Short Trend
After the big decline of the previous move, the price came back up to horizontal resistance and FIB 50%.
Price Action - Doji bar on strong level of resistance - signal for short

Alternative scenario: If the price moves above the FIB 50% and above 0,77250 will cancel the bearish view
Technical indicator:
DEM (14)H4 - In the middle of the range
Sentiment: Its positive, but after the higher moves on the indices for the last 3 days, they are at levels of resistance and we could see corrections, which will help this pair to trade lower by the trend.
Price for Entry short around: 76,90
SL: 77.250
Jr. Trader - S. Fuchedzhiev
 Varchev Traders
RECCOMEND
WAS THIS POST USEFUL FOR YOU?
If you think, we can improve that section,
please comment. Your oppinion is imortant for us.
If you think, we can improve that section,
please comment. Your oppinion is imortant for us.

