

- Home
- >
- FX Daily Forecasts
- >
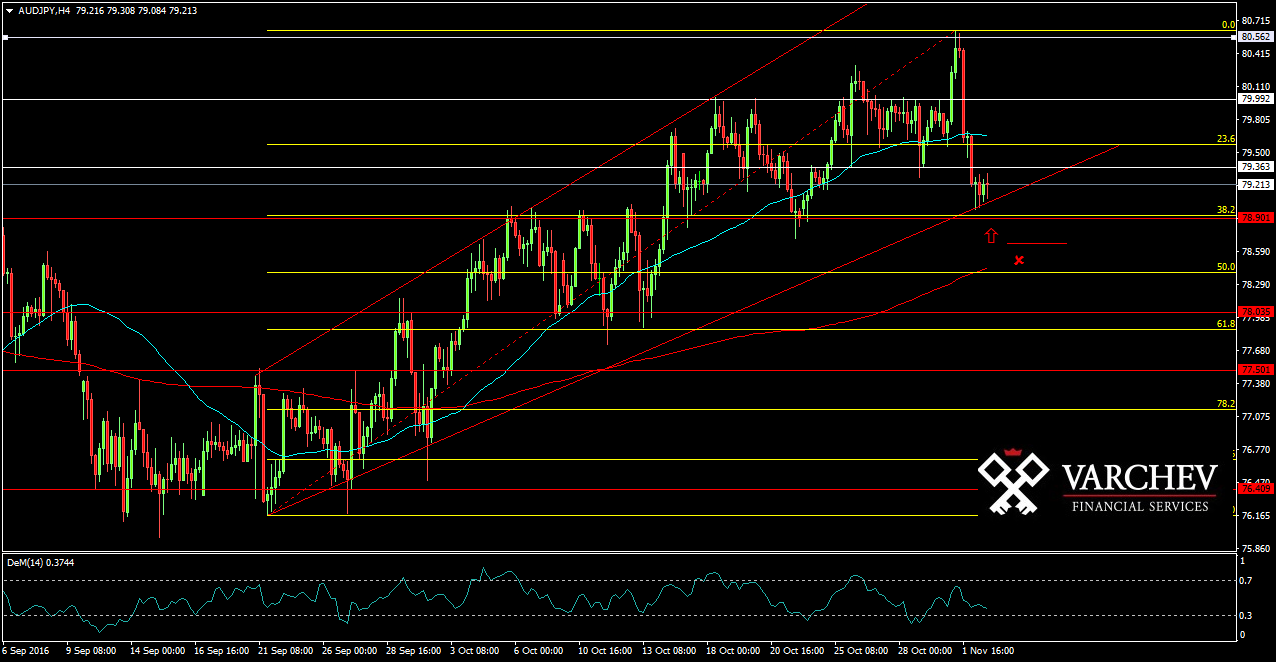
- AUD/JPY: Possible new long after correction down to strong horizontal support and Fibo 38.2%

AUD/JPY: Possible new long after correction down to strong horizontal support and Fibo 38.2%
Rating:

AUD/JPY:
Date: 2 November, 2016
H4 Graph: Long Trend
The price made a correction after reaching the high of 80.560 down to horizontal support at 78,900 and here there is Fib level of 38,2%. The long diagonal support also comes in just below the price to support it. The pair makes higher highs and higher lows.
Price Action: Pin bar at a level of support - Signal for long

Alternative Scenario: If the price breaks to the down side below the diagonal support and Fib 38,2, this will cancel the bullish view.
Technical Indicator:
DEM (14): - Closer to the oversold zone
Price for Entry long around: 79.100
SL: 78.650
Jr. Trader - S. Fuchedzhiev
 Varchev Traders
RECCOMEND
WAS THIS POST USEFUL FOR YOU?
If you think, we can improve that section,
please comment. Your oppinion is imortant for us.
If you think, we can improve that section,
please comment. Your oppinion is imortant for us.

