

- Home
- >
- FX Daily Forecasts
- >
- AUD/JPY: Short is more likely to continue

AUD/JPY: Short is more likely to continue
Rating:

AUD/JPY:
Date: May, 10, 2016
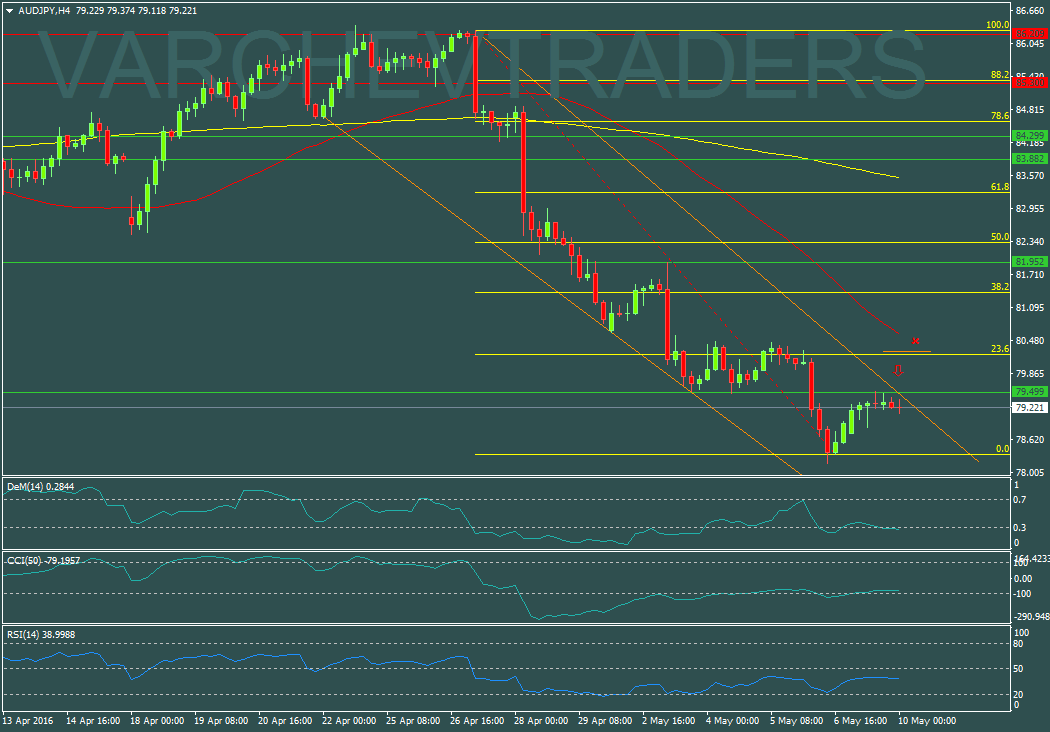
H4 Graph: Short Trend
The price broke support below 79,50 and now came back to retest this level of resistance, even that we do not have a valid Fibo level for the correction.
Price Action: Doji formation at level of resistance and end of the corrective move

Alternate scenario: If the price break up above 79,50 and above the previous high,this will cancel the bearish view
Technical Indicators:
DEM (14) H4 - Still not in the over sold zone
CCI (50) D1+H4 - Both time frames is below 0
RSI (14) H4 - is below 50
Price for short around: 79,5
SL: 80.20
Jr. Trader - С. Фучеджиев
 Varchev Traders
 Read more:
 FOREX: Bulls on EURUSD with sight for 1.1300; Основни подкрепи и съпротиви 16.05.2019
 How to trade the AUDJPY breakout
 AUDNZD multiple signals that the bottom is close
 AUD at key technical levels, but the data for China weighs on the fundament
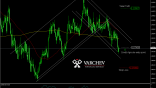 Crédit Agricole with Long recommendation of AUD/NZD – SL: 1.0590 – TP: 1.1050
RECCOMEND
WAS THIS POST USEFUL FOR YOU?
If you think, we can improve that section,
please comment. Your oppinion is imortant for us.
If you think, we can improve that section,
please comment. Your oppinion is imortant for us.

