

- Home
- >
- FX Daily Forecasts
- >
- AUD/JPY signal for a probable downward movement

AUD/JPY signal for a probable downward movement
Rating:

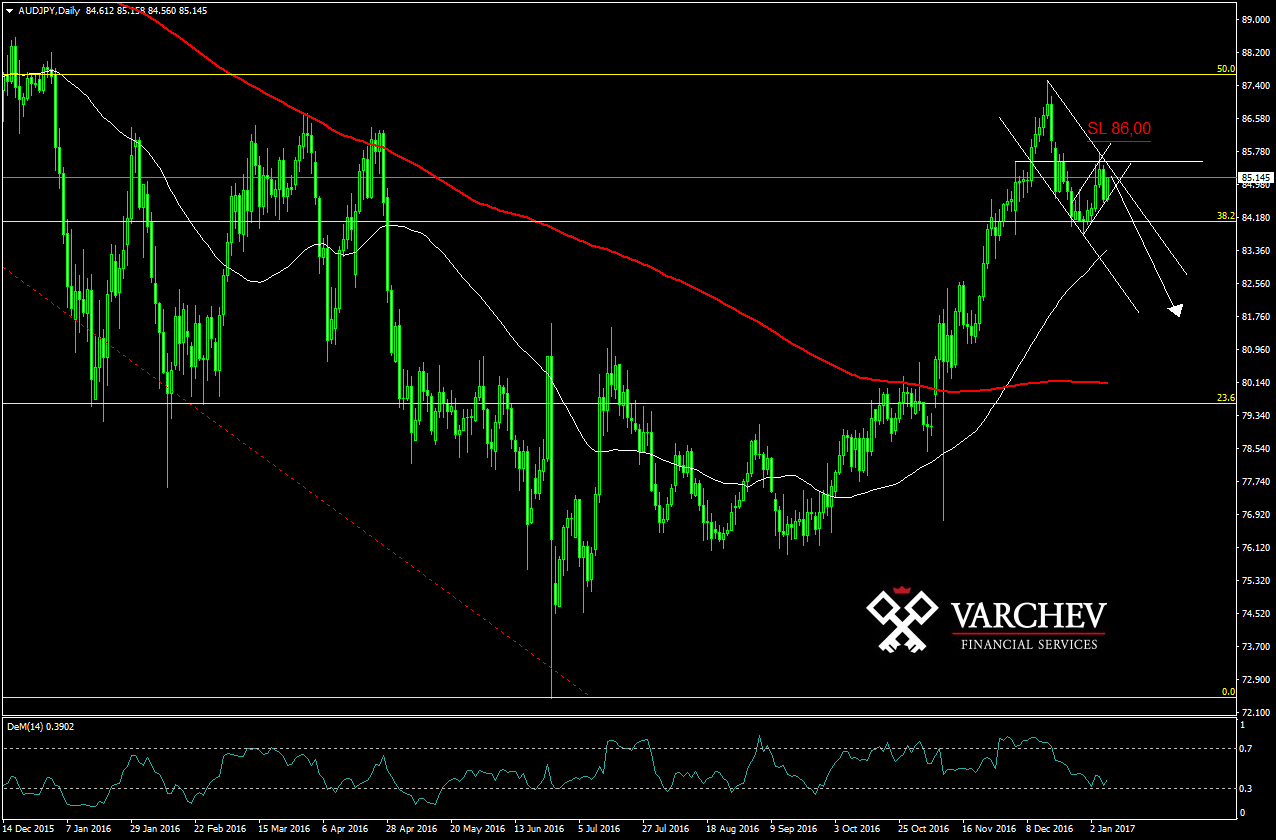
AUD/JPY 06.01.2017 D1 chart.
50% Fibonacci of the long term downtrend and beginning of a new downward movement.
Price below diagonal and horizontal resistances.
Price action: Bearish engulfing at levels of resistance, as the correction of the bar gives us good price for short positions.
Technical indicators:
DeM(14) above 0,3 still haven't been in oversold zone which makes a sharp downward impulse very likely after crossing below 0,3
SL 86.00
Alternative scenario: If price breaks above the resistances this will cancel the bearish formation and will probably lead to increase in price.
Jr. Trader Nikolay Georgiev
 Varchev Traders
 Read more:
 FOREX: Bulls on EURUSD with sight for 1.1300; Основни подкрепи и съпротиви 16.05.2019
 How to trade the AUDJPY breakout
 AUDNZD multiple signals that the bottom is close
 AUD at key technical levels, but the data for China weighs on the fundament
 Crédit Agricole with Long recommendation of AUD/NZD – SL: 1.0590 – TP: 1.1050
RECCOMEND
WAS THIS POST USEFUL FOR YOU?
If you think, we can improve that section,
please comment. Your oppinion is imortant for us.
If you think, we can improve that section,
please comment. Your oppinion is imortant for us.

