

- Home
- >
- FX Daily Forecasts
- >
- AUD/JPY: The continued long is more possible, after a Price Action signal

AUD/JPY: The continued long is more possible, after a Price Action signal
Rating:

AUD/JPY:
Date: 6 January, 2017
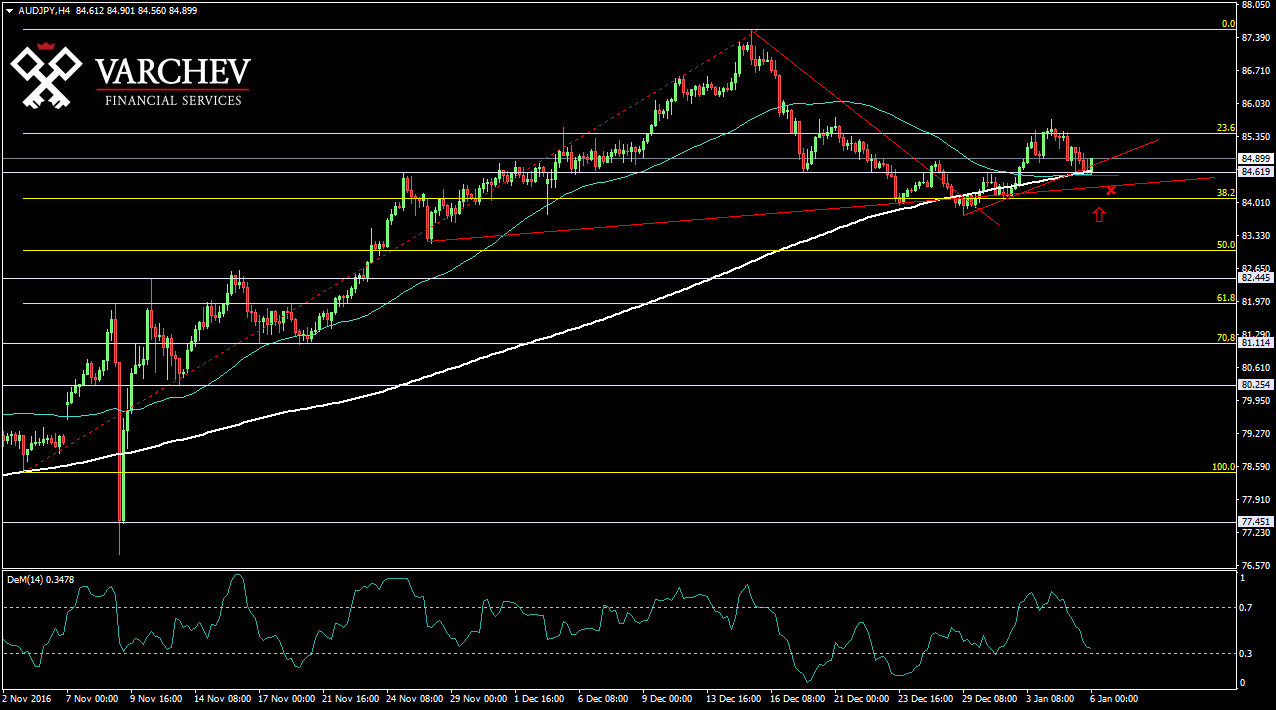
H4 Graph: Long Trend
The price did made a correction down, but it seems that its over now and we might see a long move again. The correction down stopped at Fib 38.2% and horizontal and diagonal supports. The price is also trading above both 50 and 200 ЕМА.
Price Action: 3 higher highs and higher lows - Possible signal for long
DEM (14) - Its close to the oversold zone
Alternative scenario: If the price continue down and passes below the diagonal and horizontal supports, this will cancel the bullish view.
Price for Entry long around: 84.800
SL: 84.300
Jr. Trader - S. Fuchedzhiev
 Varchev Traders
 Read more:


RECCOMEND
WAS THIS POST USEFUL FOR YOU?
If you think, we can improve that section,
please comment. Your oppinion is imortant for us.
If you think, we can improve that section,
please comment. Your oppinion is imortant for us.

