

- Home
- >
- FX Daily Forecasts
- >
- AUD/NZD: Correction of FIB zone and Bearish Flag, possibly short to continue

AUD/NZD: Correction of FIB zone and Bearish Flag, possibly short to continue
Rating:

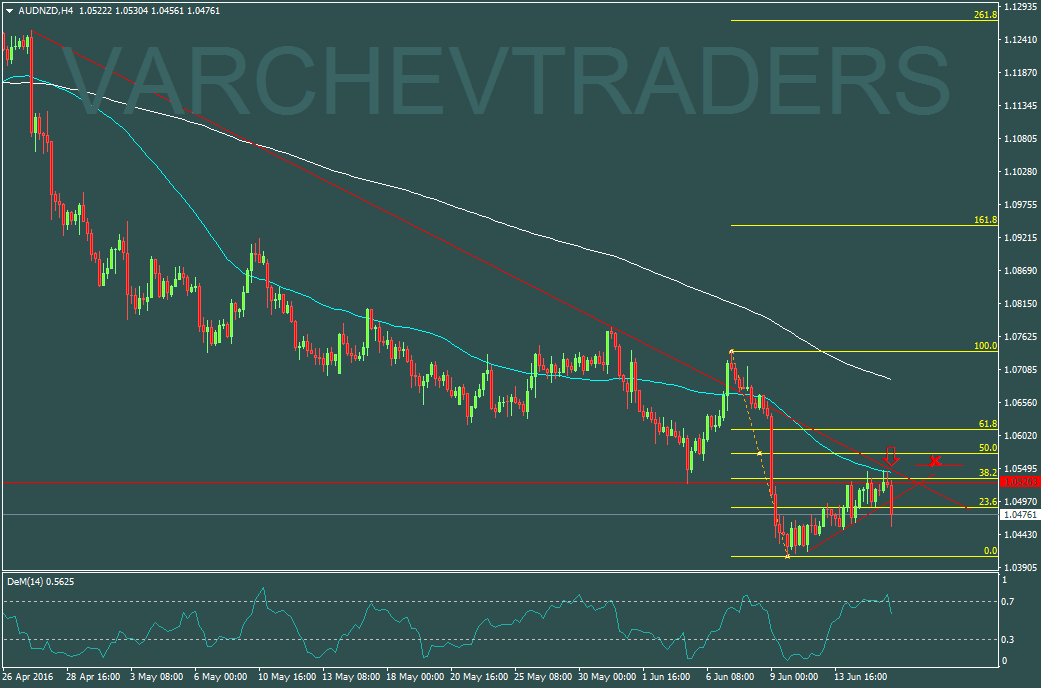
AUD/NZD:
Date: June 16, 2016
H4 Graph: Short Trend
After the short move down and break of he important horizontal support on level of 1,05260/1,05500 and FIB 38.2, the price made a correction for a retest and formed a bearish flag. Now the price breaks the bearish flag to continue down by the trend.
Price Action: Two equal pins on level of 1,055 formation for reversing of th move

Alternative scenario: If the price moves up above the previous high and above 1.055 will cancel the bearish view.
Technical Indicator:
DEM (14) - Reached overbought zone and turned down for short
Price Entry for short around: 1,0500
SL: 1.0555
Jr. Trader - S. Fuchedzhiev
 Varchev Traders
RECCOMEND
WAS THIS POST USEFUL FOR YOU?
If you think, we can improve that section,
please comment. Your oppinion is imortant for us.
If you think, we can improve that section,
please comment. Your oppinion is imortant for us.

