

- Home
- >
- FX Daily Forecasts
- >
- AUD/NZD: Good Place for a new long, close to diagonal support

AUD/NZD: Good Place for a new long, close to diagonal support
Rating:

AUD/NZD:
Date: 15 November, 2016
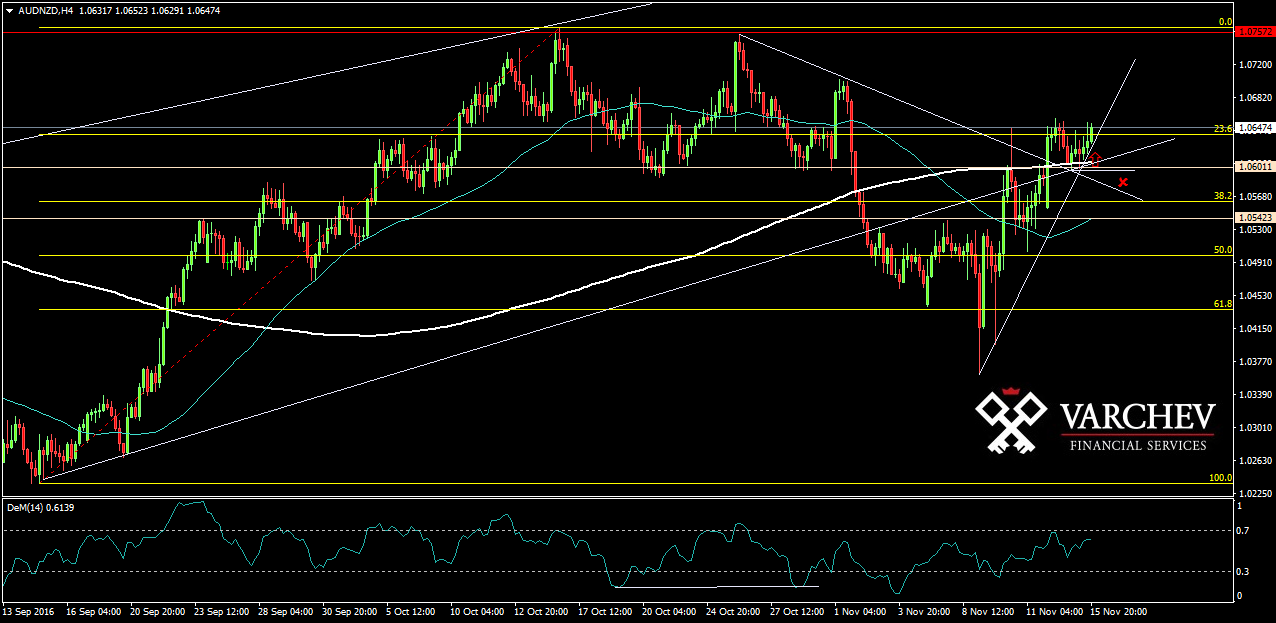
H4 Graph: Long Trend
After the price made a deep correction down to Fib level of 61,8% to 1.036, price started moving up and break up above two horizontal resistances 1.054 and 1.060. Now price continue up after it made a retest of the horizontal and diagonal supports at 1.060. The price is close to the diagonal support and this is a good place for a long.
Price Action: Pin bar at horizontal and diagonal support - Possible signal for long

Alternative scenario: If the price move down again below the horizontal and diagonal supports and below 1.0600, this will cancel the bullish view.
Technical Indicator:
DEM (14) - Close to the overbought zone
Price for Entry long around: 1.064
SL: 1.05900
Jr. Trader - S. Fuchedzhiev
 Varchev Traders
 Read more:
 FOREX: Bulls on EURUSD with sight for 1.1300; Основни подкрепи и съпротиви 16.05.2019
 How to trade the AUDJPY breakout
 AUDNZD multiple signals that the bottom is close
 AUD at key technical levels, but the data for China weighs on the fundament
 Crédit Agricole with Long recommendation of AUD/NZD – SL: 1.0590 – TP: 1.1050
If you think, we can improve that section,
please comment. Your oppinion is imortant for us.

