

- Home
- >
- FX Daily Forecasts
- >
- AUD/NZD: Short by the trend, at diagonal resistance after 3 lower highs

AUD/NZD: Short by the trend, at diagonal resistance after 3 lower highs
Rating:

AUD/NZD:
Date: 29 November, 2016
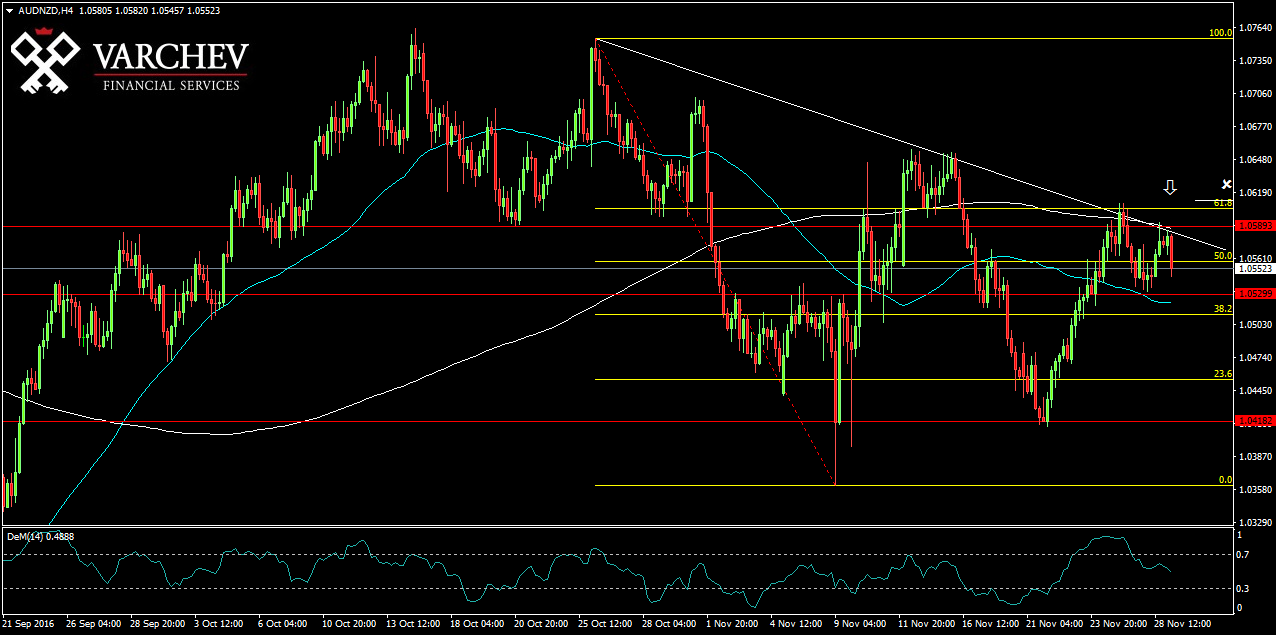
H4 Graph: Short Trend
Price again came up with correction. Again it tried to break the diagonal resistance two times. Horizontal resistance at 1.05900 which level did not break and price again is below it. Fib level of 61.8% did hold as well. 50/200 EMA cross is in bearish formation.
Price Action: Pin bar at horizontal and diagonal resistance - Possible signal for short
Alternative scenario: If the price breaks above and moves above the Fib 61.8% and above the both horizontal and diagonal resistances, this will cancel the bearish view.
Technical Indicator:
DEM (14) - Already turned down for short
Price for Entry short around: 1.05700
SL: 1.06200
Jr. Trader - S. Fuchedzhiev
 Varchev Traders
 Read more:
 FOREX: Bulls on EURUSD with sight for 1.1300; Основни подкрепи и съпротиви 16.05.2019
 How to trade the AUDJPY breakout
 AUDNZD multiple signals that the bottom is close
 AUD at key technical levels, but the data for China weighs on the fundament
 Crédit Agricole with Long recommendation of AUD/NZD – SL: 1.0590 – TP: 1.1050
RECCOMEND
WAS THIS POST USEFUL FOR YOU?
If you think, we can improve that section,
please comment. Your oppinion is imortant for us.
If you think, we can improve that section,
please comment. Your oppinion is imortant for us.

