

- Home
- >
- FX Daily Forecasts
- >
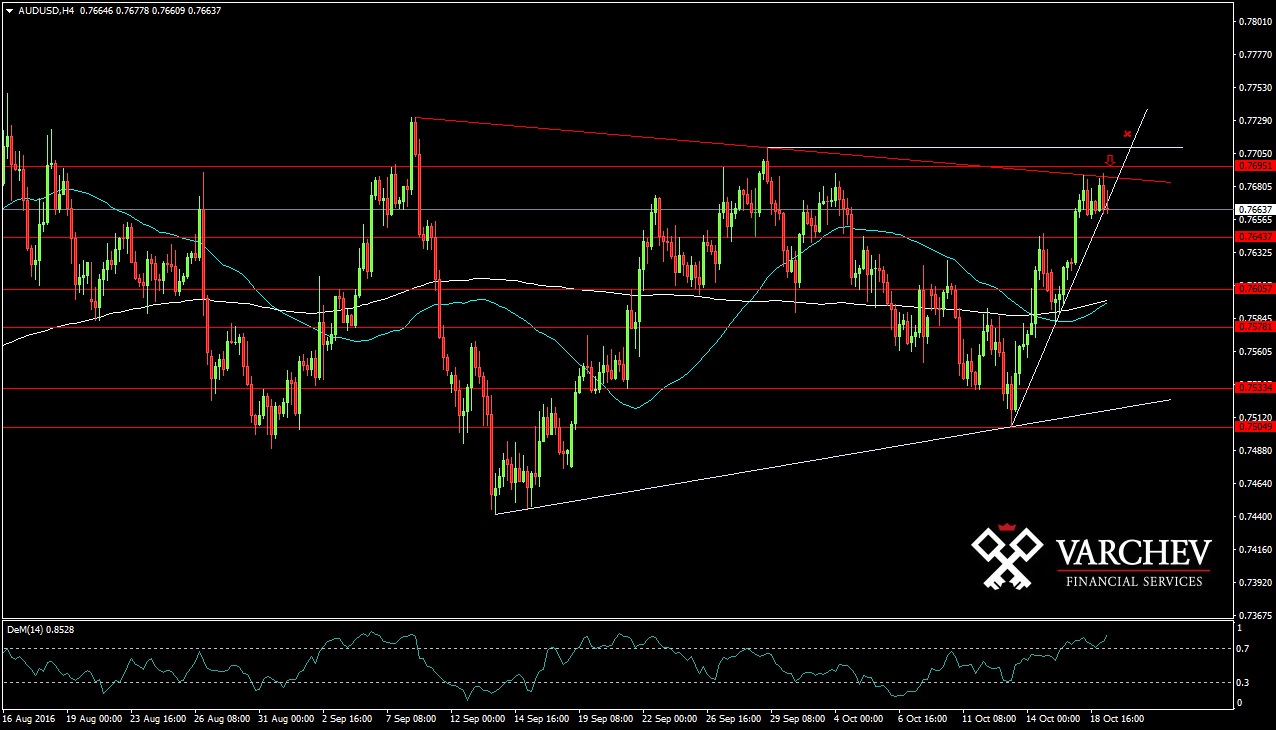
- AUD/USD: Good levels for short below the diagonal resistance

AUD/USD: Good levels for short below the diagonal resistance
Rating:

AUD/USD:
Дата: October 19, 2016
H4 Chart: Medium-term short
Price tendency is short after the formation of 4th higher peak. It is possible to form a double top at a lower time frame. The horizontal resistance at 0,76900 is holding and the price remains below it. 50MA is still below 200MA.

Alternative scenario: If the price breaks trough upwards above the diagonal and horizontal resistance this will break the bearish scenario:
Technical indicators:
DEM (14): In overbought area but still has not turned for short
Price entry at around: 0,76770
SL: 0.77300
Jr. Trader - S.Fuchedzhiev
 Varchev Traders
RECCOMEND
WAS THIS POST USEFUL FOR YOU?
If you think, we can improve that section,
please comment. Your oppinion is imortant for us.
If you think, we can improve that section,
please comment. Your oppinion is imortant for us.

