

- Home
- >
- FX Daily Forecasts
- >
- AUD/USD: New short close to a horizontal and diagonal resistance, after a Price Action signal

AUD/USD: New short close to a horizontal and diagonal resistance, after a Price Action signal
Rating:

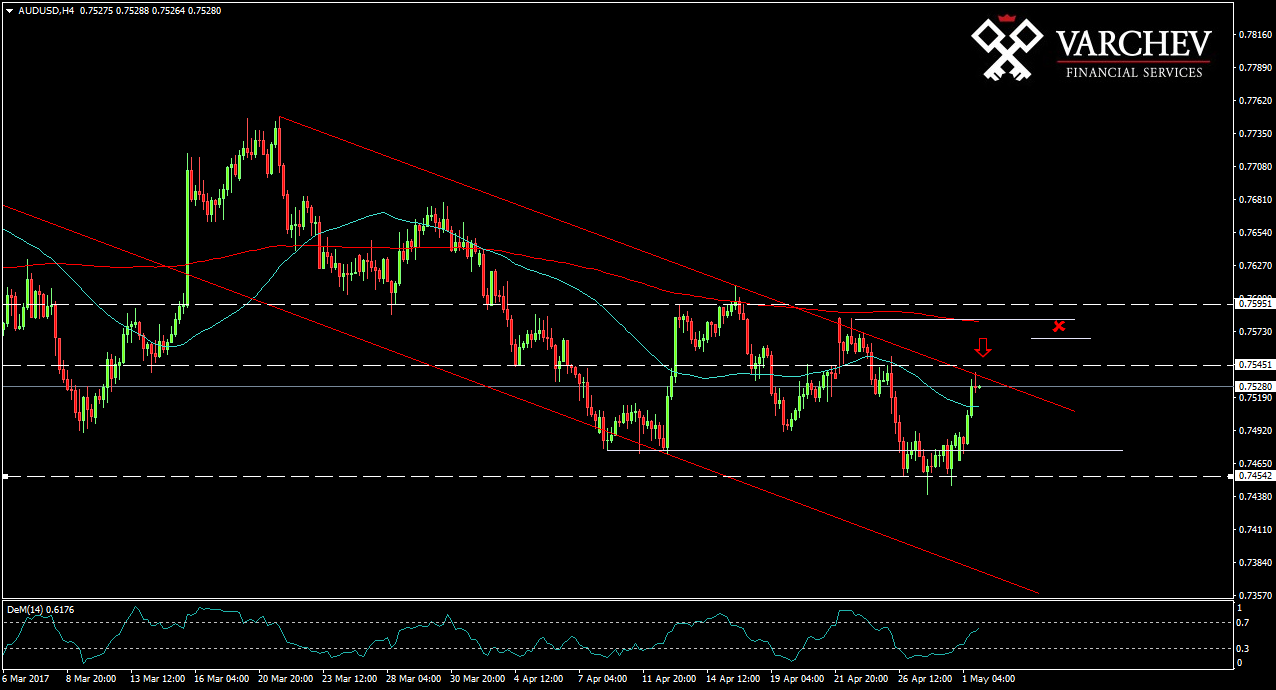
AUD/USD, 01.05.2017
H4 time chart: long-term choppy, mid-term short
The price formed a bullish channel and uses the upper side as a resistance. After the price made a lower low, it reversed to the upper part of the channel and now there's a possibility for a new declining movement. Here, the price meets the resistance on about 0.75470 and a diagonal resistance. 50 EMA is still under 200 EMA in bullish formation.
Price Action: Doji bar on horizontal and diagonal resistance levels - probable signal for a short movement.
DeM - close to over-bought level.
Alternative scenario: If the price breaks and maintains levels above the diagonal and horizontal supports, this movement might be denied.
Entry price: 0.753
Trader Senan Fuchedzhiev
 Varchev Traders
 Read more:


RECCOMEND
WAS THIS POST USEFUL FOR YOU?
If you think, we can improve that section,
please comment. Your oppinion is imortant for us.
If you think, we can improve that section,
please comment. Your oppinion is imortant for us.

