

- Home
- >
- Opportunities for profit today
- >
- AUD/USD: Possible new short positions

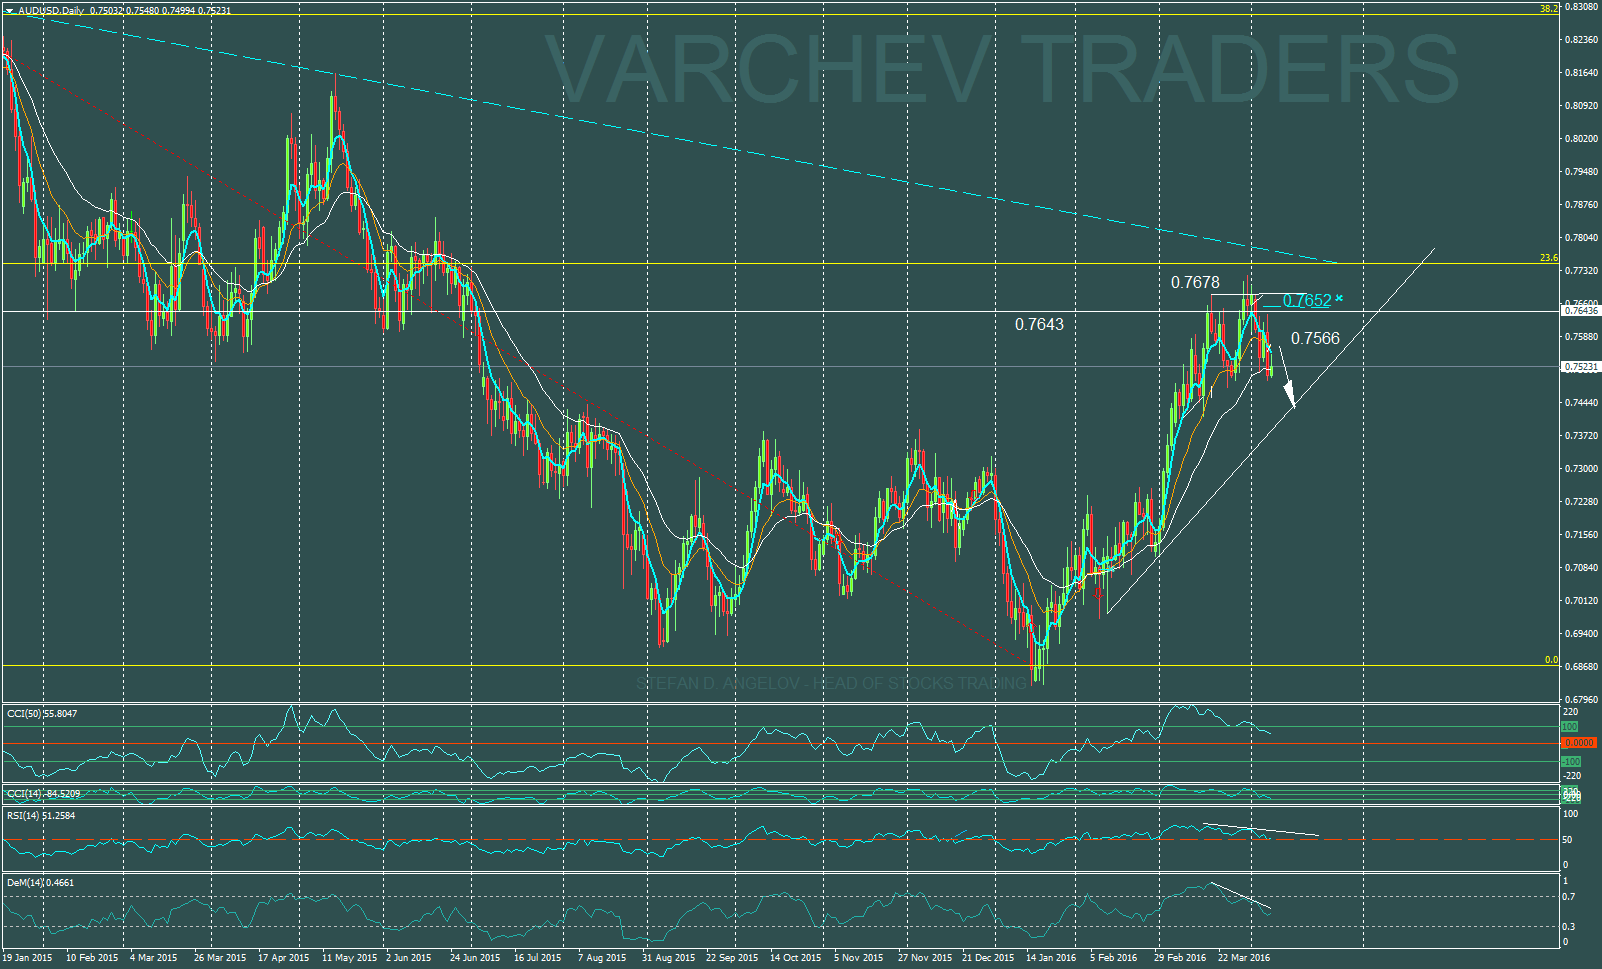
AUD/USD: Possible new short positions
Rating:

AUD/USD: Daily Graph: Trend short, short term correction
FIBO level of correction38.2% of the short trend
price action: Spinning Tops, negative signal
Engulfing bar - signal for sell
Fake break above 0.7678, price fell below the pin bar
Divergence: Price /indicator for short
50% correction of the short term short and new price action signal for another short
Indicators:
CCI(50) moves below 100
Divergence: Price is making higher high, DeM lower low below 0.7
RSI Divergence
SL: 0.7652
Alternate scenario:
Only higher high will cancel the negative formation
 Varchev Traders
RECCOMEND
WAS THIS POST USEFUL FOR YOU?
If you think, we can improve that section,
please comment. Your oppinion is imortant for us.
If you think, we can improve that section,
please comment. Your oppinion is imortant for us.

