

- Home
- >
- Opportunities for profit today
- >
- AUD/USD: Possible short, double top

AUD/USD: Possible short, double top
Rating:

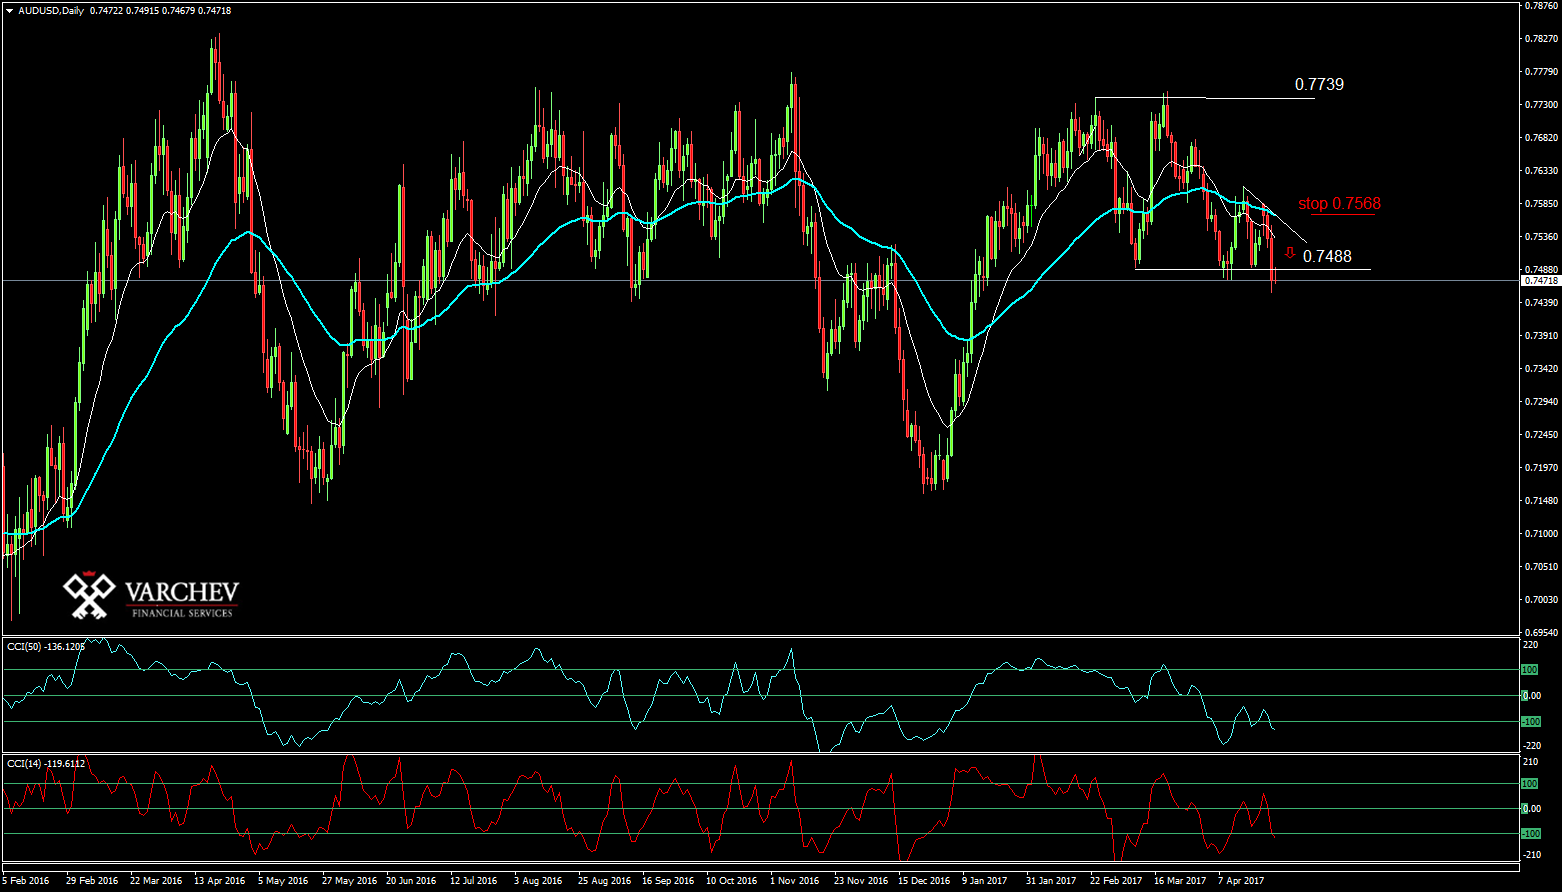
AUD/USD: Long term Trend - short, medium term Choppy and short term down move
Price closed below level of support at 0.7488 - negative signal for possible move lower and break of support
Double top at level of 0.7739 and break below the neckline - the figure is activated.
Indicators in negative territory: CCI(50) below -100, as CCI(14) moves below -100 - strong negative sentiment, possible new impulse to the downside.
Stop loss at 0.568
Alternative scenario: If the price moves above the previous bar, will give bullish signal, in situation like this one, the reversal bar becomes stronger signal for long.
Stefan D. Angelov - Head of Stocks trading
 Varchev Traders
 Read more:
 FOREX: Bulls on EURUSD with sight for 1.1300; Основни подкрепи и съпротиви 16.05.2019
 How to trade the AUDJPY breakout
 AUDNZD multiple signals that the bottom is close
 AUD at key technical levels, but the data for China weighs on the fundament
 Crédit Agricole with Long recommendation of AUD/NZD – SL: 1.0590 – TP: 1.1050
RECCOMEND
WAS THIS POST USEFUL FOR YOU?
If you think, we can improve that section,
please comment. Your oppinion is imortant for us.
If you think, we can improve that section,
please comment. Your oppinion is imortant for us.

