

- Home
- >
- FX Daily Forecasts
- >
- AUD/USD: Price Action signal for possible short continuation

AUD/USD: Price Action signal for possible short continuation
Rating:

AUD/USD:
Date: June 1, 2016
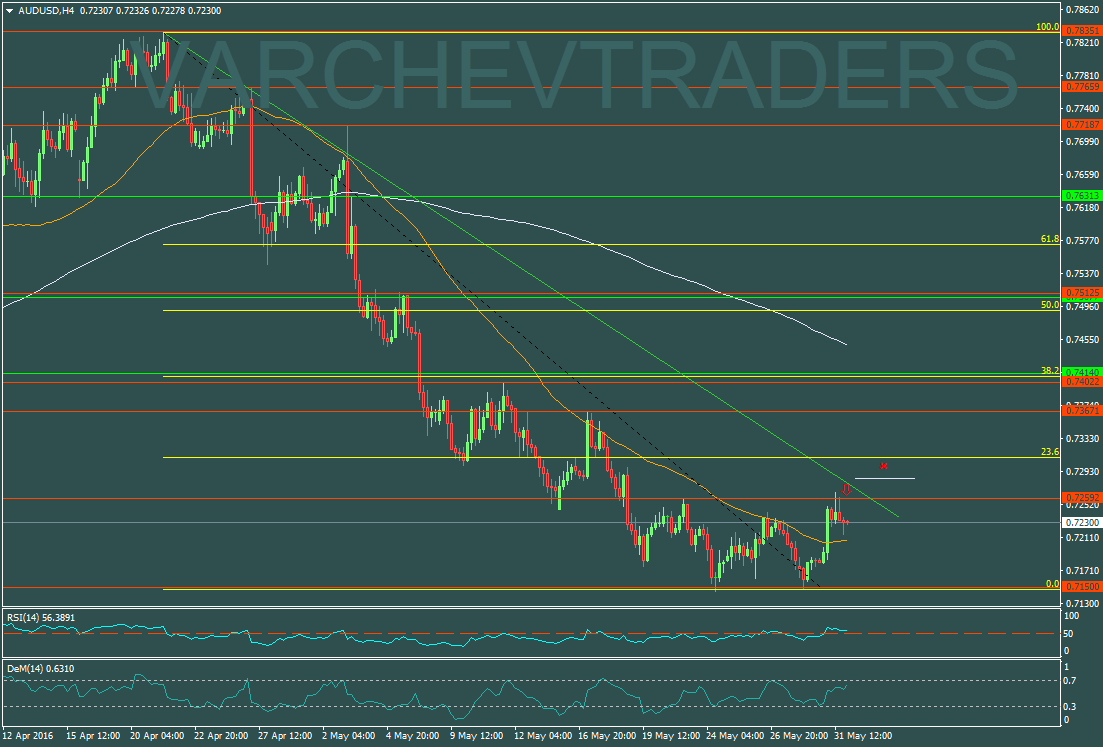
H4 Graph: Short Trend
The Price has made a correction to horizontal resistance at levels of 0,72600 it holds below it.
Price Action: Hammer formation for short - signal for short

Alternative Scenario: If the price moves up above 0.7300 and Fib 23,6% will cancel the bearish view.
Technical Indicators:
DEM (14) H4 - Its still not in overbought zone
RSI (14) H4 - above 50 - Stronger signal for short can be waited by passing of the indicator below 50
Price for Short around: 0,72400
SL: 0.73000
Jr. Trader - S. Fuchedzhiev
 Varchev Traders
 Read more:
 FOREX: Bulls on EURUSD with sight for 1.1300; Основни подкрепи и съпротиви 16.05.2019
 How to trade the AUDJPY breakout
 AUDNZD multiple signals that the bottom is close
 AUD at key technical levels, but the data for China weighs on the fundament
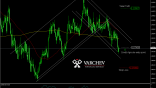 Crédit Agricole with Long recommendation of AUD/NZD – SL: 1.0590 – TP: 1.1050
RECCOMEND
WAS THIS POST USEFUL FOR YOU?
If you think, we can improve that section,
please comment. Your oppinion is imortant for us.
If you think, we can improve that section,
please comment. Your oppinion is imortant for us.

