

- Home
- >
- Stocks Daily Forecasts
- >
- Bear Market Rally Or Start Of A New Bull on S&P500? What To Look For

Bear Market Rally Or Start Of A New Bull on S&P500? What To Look For

Rating:

Recent sentiment data shows investors to be more pessimistic than they have been in at least 4 years. Some sentiment data is the most extreme in 14 years. A recent post on this here.
The rub with this data is this: some of these sentiment extremes in the past came at the start of new bull markets and some only marked the start of a rally within an ongoing bear market. Let's assume that the rally now is only a bear market rally. What might it look like?
Bear market rallies can be as short as a week or last as long as 3 months. Gains are at least 7-8% and can be as much as 20% or more.
In real time, distinguishing a bear market rally from the start of a new bull market can be tricky. It's not unusual for the 50-dma to turn around and begin rising. After a 3 month rally, the bear market decline that preceded it can feel like a long time ago, making investors once again optimistic and bullish.
Let's look at the 2008-09 S&P 500 bear market first:
There were seven bear market rallies during a period of just 14 months, and three of these lasted 6-8 weeks.
That means there was a rally about every other month.
All except one made it back to the 50-dma (green line).
Gains were a minimum of 7-8% and two gained 20% or more.
Each of these rallies had a hard time staying overbought. These rallies generally started to fail as soon as RSI(5) exceeded 70% (top panel). The one exception was the March-May 2008 rally, which was strong enough to turn the 50-dma upwards. That gain was 12%.

The 2000-02 bear market is shown below:
There were seven bear market rallies during a period of 24 months.
All of them lasted at least a month and two lasted 3 months.
There was usually a rally every other month, although two rallies were 4 months apart.
Each one made it back to the 50-dma (green line), which started to rise on four different occasions.
Gains were a minimum of 8-9% and four were 20% or more.

There was a bear market rally until last Thursday. We will be watching to see if RSI(5) can remain overbought (top panel). This will be a good sign. A rising 50-dma will also be a good sign, but be mindful that it has given a false sense of security during bear markets in the past.
Investing
 Varchev Traders
 Read more:
 US – Iran – Iraq tension remain the main driver of the stock market today
 How top market players on Wall St think 2020 will look like on financial markets
 Money Flow before the start of the new trading week
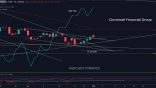 Cincinnati Financial Corporation (CINF.US) -Opportunity for long positions
 Asia stocks gain as Fed signals no rate cuts in 2020
If you think, we can improve that section,
please comment. Your oppinion is imortant for us.

