

- Home
- >
- Stocks Daily Forecasts
- >
- Bloomberg”Market Breadth” indicator signals a possibility for a deeper correction

Bloomberg"Market Breadth" indicator signals a possibility for a deeper correction
Rating:

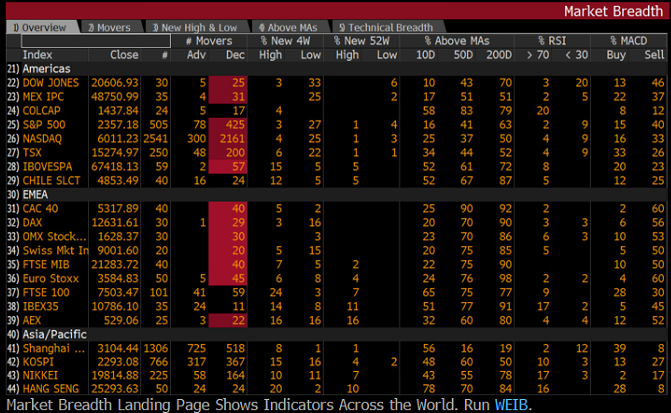
Market Breadth takes a measure of the strength of an index’s price trend by looking at how individual members of the index are performing.
On May 16 both the S&P 500 and the Nasdaq made new highs. The percentage of individual stocks in the S&P 500 that made a new 52-week high was 12 percent, down from 27 percent on March 1. This suggests fewer stocks were participating in the rally over time. When breadth statistics and price action stop moving in the same direction it’s a warning signal that a correction may come.

The number of stocks in the S&P 500 Index that are trading above their 200-day moving average is showing a similar divergence.

Source: Bloomberg pro terminal
Trader Nikolay Georgiev
 Varchev Traders
 Read more:
 Tom DeMark says charts show early signs of market top
 The stock market just entered a dead zone that sees it drop 70% of the time
 ‘Dangerous volatility’ is inciting flashbacks to the financial crisis
 Why Bears Have Got It Wrong About This Market
 Goldman says so many investors are expecting a market correction that means it likely won’t happen
RECCOMEND
WAS THIS POST USEFUL FOR YOU?
If you think, we can improve that section,
please comment. Your oppinion is imortant for us.
If you think, we can improve that section,
please comment. Your oppinion is imortant for us.

