

- Home
- >
- Cryptocurrencies / Algotrading
- >
- BTC: Pullback to $6500 or $10000?

BTC: Pullback to $6500 or $10000?

Rating:

n the 4-Hour Chart, Bitcoin is testing the ascending triangle trendline on the downside. However, it is still within the borders of the triangle. A break-out towards positive or negative, both is possible. A break above $8350 would be strongly bullish.
The RSI on the 4-Hour Chart is towards the over-sold region at 41. However, the price has moved below the 50-Day moving average which can be a bearish signal. The MACD is also diverging on the towards the downside.
On a daily scale, the RSI is has moved in the neutral zone between over-bought and the over-sold region at 61. Nevertheless, the MACD seems to be converging after the bullish move cooled down, which might be a bearish signal.
 Trader Georgi Bozhidarov
 Read more:
 Bitcoin is changing hands for $24,000 in Iran, based on the “Official” exchange rate
 Tendayi Kapfidze: “bitcoin is a pyramid scheme
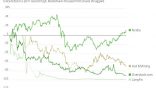 Want to Invest in Crypto? Think About Buying Stocks
 According to this rumor: A single Bitcoin whale was responsible for the astronomical price hike in 2017
 Libra faces strong opposition and China embarks on a race to launch its own global cryptocurrency
RECCOMEND
WAS THIS POST USEFUL FOR YOU?
If you think, we can improve that section,
please comment. Your oppinion is imortant for us.
If you think, we can improve that section,
please comment. Your oppinion is imortant for us.

