

- Home
- >
- Stocks Daily Forecasts
- >
- CAC 40: Paris Sock Exchange : Negative technical formation

CAC 40: Paris Sock Exchange : Negative technical formation
Rating:

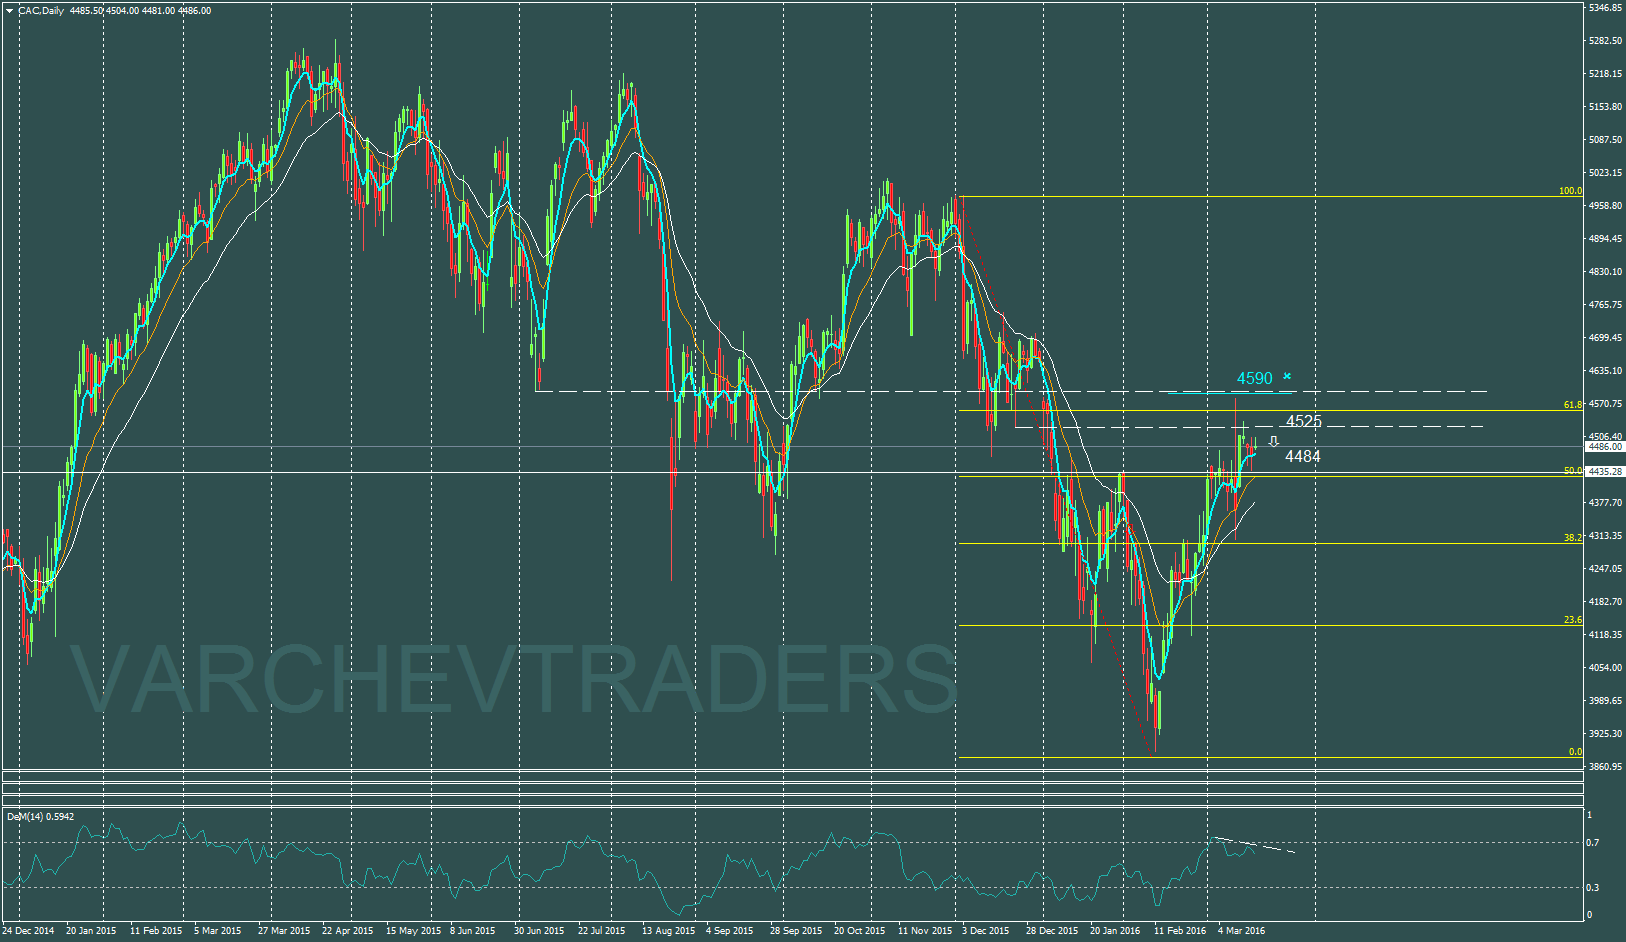
CAC 40: Paris Stock Exchange
Daily chart : Down Trend
Fibo correction 61.8% - level of resistance
double ticks,fake breakout above 4525
price action:Pin bar and price below pin bar
Possible short on current level.
Alternative: passing the price above 4590 will transform in to bullish formation.
Indicators: Demarker shows divergence which gives - negative signal
Demarker below 70 after divergence and frontier peak above 70 - strong bear signal.
Down trend the price below the resistance
entry price: 4484
SL: 4590
Stefan D. Angelov - Head of Stocks Trading
 Varchev Traders
RECCOMEND
WAS THIS POST USEFUL FOR YOU?
If you think, we can improve that section,
please comment. Your oppinion is imortant for us.
If you think, we can improve that section,
please comment. Your oppinion is imortant for us.

