

- Home
- >
- FX Daily Forecasts
- >
- CADJPY – Double top formation and possibility for a short

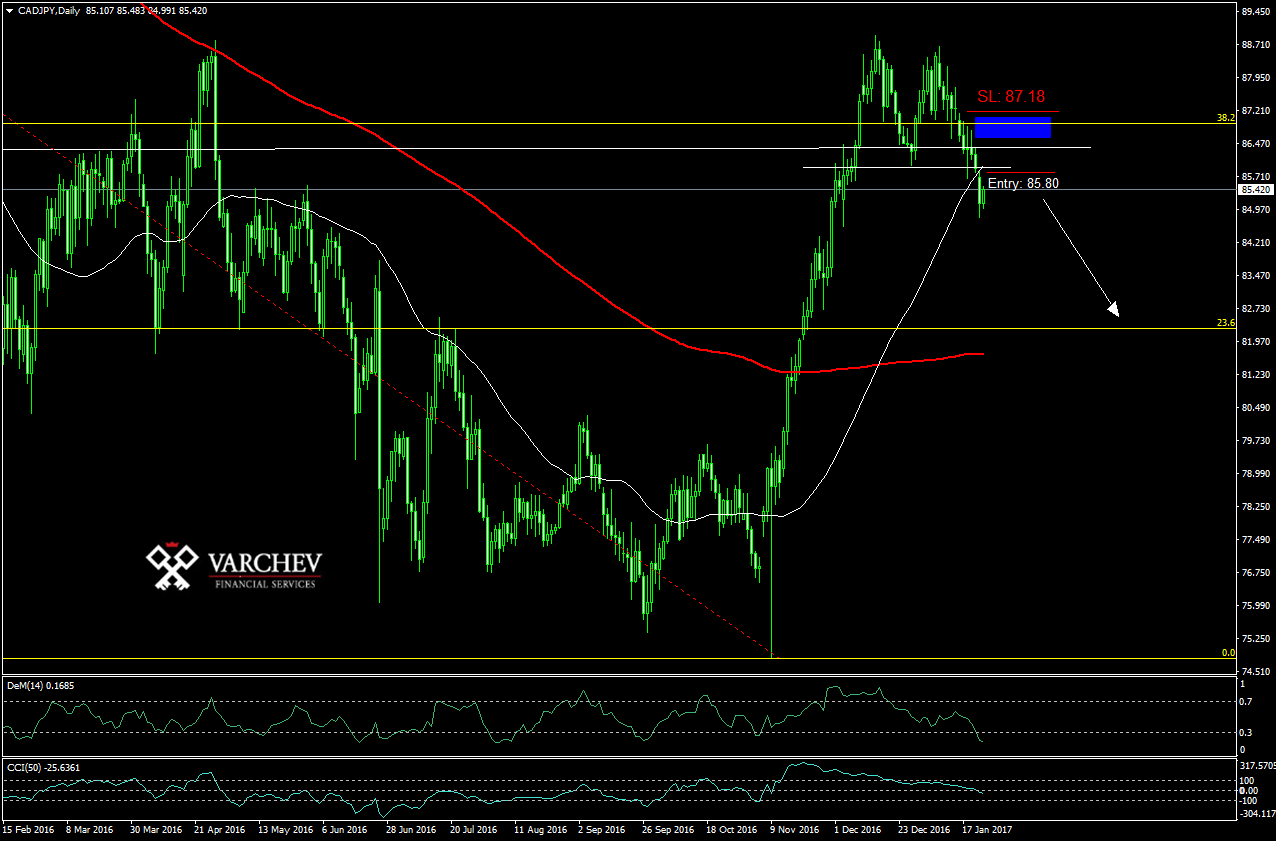
CADJPY - Double top formation and possibility for a short
Rating:

CADJPY: 24.01.2017
Timeframe: Daily chart (D1)
Long-term downtrend and middle-term correction ending with double top.
Breakthrough a horizontal support, currently resistance.
Bearish candle bar confirming the formation followed by bullish one, giving us a good levels for a short entry.
Price Action: Bearish candle bar under the horizontal line below the formation.
Technical indicators: mixed signals.
Good level for entry around 85.80.
SL: 87.18
Alternative scenario: if price goes up and closes above the horizontal resistance or above 38.2% Fibonacci then we can expect a new uptrend movement.
Jr_Trader_Ivan_Ivanov
 Varchev Traders
 Read more:
 FX expiring options today 22.02.2019
 AUD at key technical levels, but the data for China weighs on the fundament
 Bloomberg survey expect the negative sentiment for USD to remain in 2018
 A lack of confidence and the longer-term prospects are holding the dollar back
 Net speculative positions of CFTC as of 19.12.2017
RECCOMEND
WAS THIS POST USEFUL FOR YOU?
If you think, we can improve that section,
please comment. Your oppinion is imortant for us.
If you think, we can improve that section,
please comment. Your oppinion is imortant for us.

