

- Home
- >
- Stocks Daily Forecasts
- >
- Capita PLC: Inverted head activated, for increace

Capita PLC: Inverted head activated, for increace
Rating:

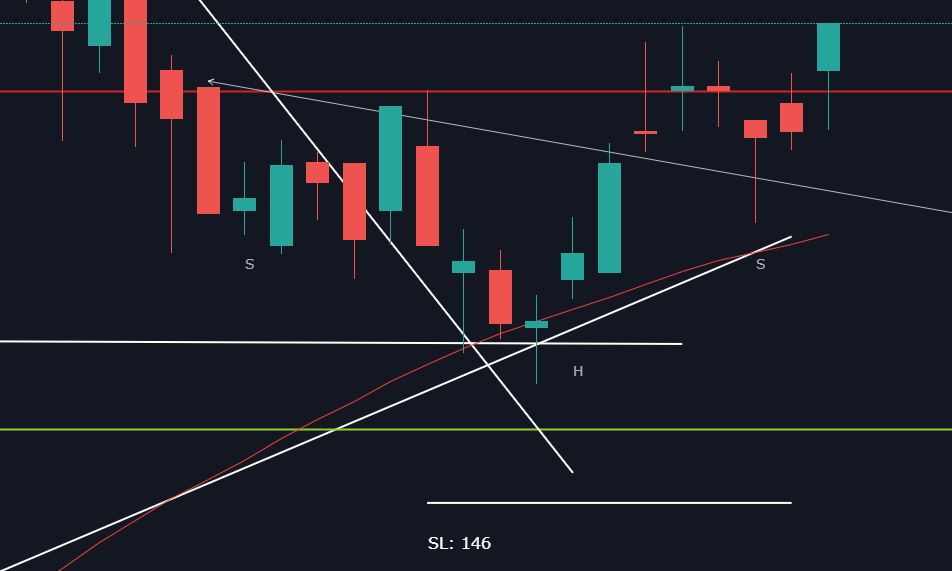
CPI.US D1 Our expectations:
Long trend and short term short correction. Activated formation inverted head & shoulders for increace. Break and test of the neck line.
Break of diagonal resistance, the previous bar closed above. Price cannot make a new bottom.
Price action: Activated figure, inverted Head & Shoulders for long.
Indicators:
Fake breakthrough 23.6% Fibonacci. The price holds above.
Price above 50 and 200SMA. MAs in a bullish formation.
DeMarker in neutral territory.
SL: 146.

Alternative scenario: Break below 146 means a new bottom and deeper correction.
 Trader Georgi Bozhidarov
 Read more:
 DAX continues consolidate
 Sodexo – Breakthrough the short trend channel and forming a new upward trend
 Norma Group (NOJ): Breakthrough a key resistance zone
 Canopy Growth Corporation (CGC) Breakthrough the bearish channel, possible long
 BNP: Breakthrough the downward trend. Confirming break of a previous high. A new upward trend channel is emerging
RECCOMEND
WAS THIS POST USEFUL FOR YOU?
If you think, we can improve that section,
please comment. Your oppinion is imortant for us.
If you think, we can improve that section,
please comment. Your oppinion is imortant for us.

