

- Home
- >
- Stocks Daily Forecasts
- >
- CAT-US possibility to expand your portfolio with Caterpillar

CAT-US possibility to expand your portfolio with Caterpillar
Rating:

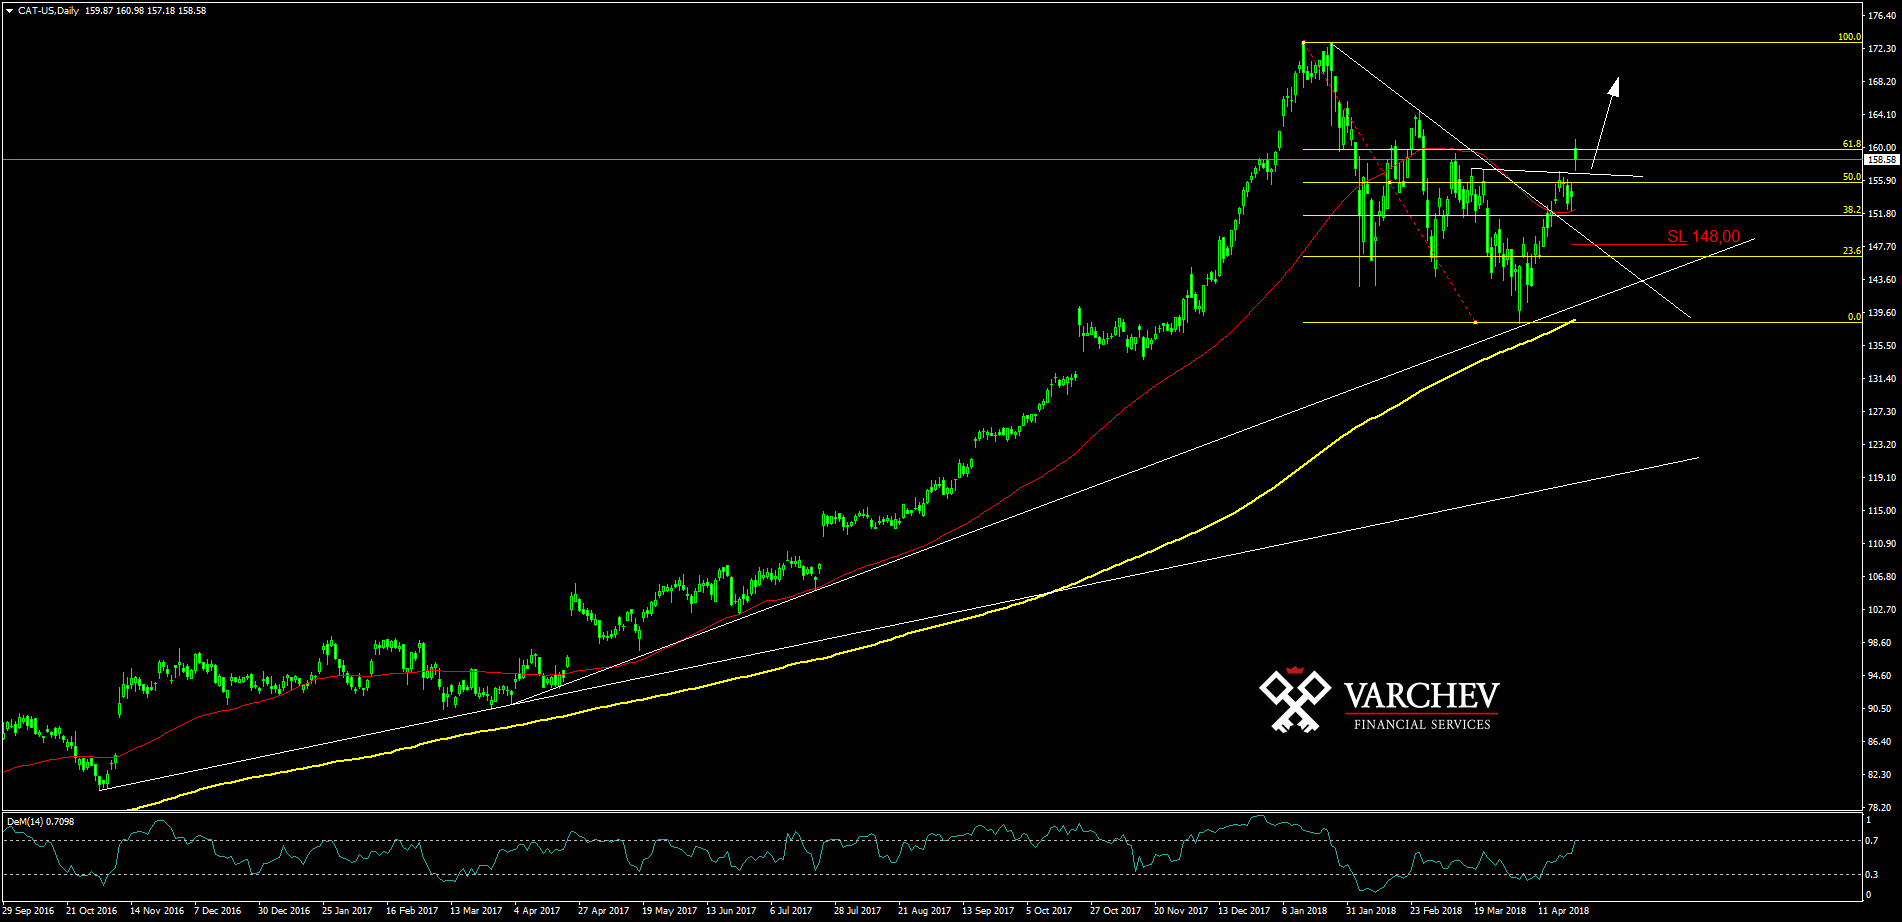
CAD-US D1 chart Our expectations:
Ascending trend, as the price breaks above the neckline of the formed Head & Shoulders with gap, signalizing possible end of the correction. Possibility for long positions with SL at levels 148,00.
The price is above the moving averages 50 SMA and 200 SMA - positive signal
DeM(14) breaking above 0.7, in zone of overbought which often is signal for increasing purchases.
The price is close to filling the gap which makes it appropriate to enter in position with minimized risk.
Alternative scenario: Pulling back below 50 SMA and complete closed candle below, will dismiss the positive scenario.
Read more:


RECCOMEND
WAS THIS POST USEFUL FOR YOU?
If you think, we can improve that section,
please comment. Your oppinion is imortant for us.
If you think, we can improve that section,
please comment. Your oppinion is imortant for us.

