

- Home
- >
- Stocks Daily Forecasts
- >
- Chart: Why Nasdaq, not Dow is the most stable index

Chart: Why Nasdaq, not Dow is the most stable index

Rating:

The popular media is focused on the Dow and the inevitable breakout above 20,000.
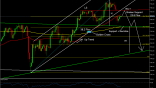
However, the best and most stable index is the Nasdaq and this is clearly seen in the monthly chart. The monthly chart is used for strategic analysis and asset allocation.
The Nasdaq chart has two analysis features.
The first feature is the long-term uptrend trading channel A. A trading channel is created by two parallel sloping trend lines. The lower trend-line starts from the Nasdaq low in March 2009. The trend-line placement is confirmed by successful rebound tests in 2011, and in February 2016.
B starts in April 2010. This trend line was broken on the upside in December.2013. After December 2013, the trend-line acted as a support level. The Nasdaq clustered around the upper trend-line until January 2016.This behavior is very bullish.
The Nasdaq dipped below the upper trend line for five months in 2016 but in July 2016, the index moved above the upper trend-line. This move signals renewed bullishness in the Nasdaq.
The Nasdaq is again using trend line B as a support level and clustering above the value of trend line B. This is a very strong bullish trend signal.

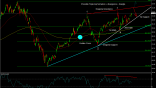
The second Nasdaq analysis feature is the construction of trading bands.
Trading bands are horizontal support and resistance levels.The lowest trading band was created and confirmed between February 2010 and February 2012. The width of this trading band was projected upwards to give the first breakout target. When this was achieved, the width of the trading band was used to set the next upside target. This method has successfully set Nasdaq breakout targets since 2012.
Using this analysis method, the most recent trading band target was 5200. This level was reached in August 2016. The width of the trading band is projected upwards and gives the next target near 5800.
The monthly chart provides strategic analysis. The trading channel defines how the Nasdaq up-trend develops. Investors expect to see the index clustering near the value of trend line B. This confirms that when the index retreats to the value of the trend line B, that it is a good buying opportunity for a continuation of the long-term uptrend.
The trade band analysis provides an answer to the question of how high the Nasdaq might rise. The analysis method sets a target near 5800. Traders may use this to set an exit near this level. Investors can use this target to watch for consolidation behavior prior to the Nasdaq moving upwards towards the next calculated trading band target.
 Varchev Traders
 Read more:


If you think, we can improve that section,
please comment. Your oppinion is imortant for us.

