

- Home
- >
- Daily Accents
- >
- Charts show Dow powers on despite verbal duel between Trump and North Korean state media

Charts show Dow powers on despite verbal duel between Trump and North Korean state media
Rating:

North Korean State Media, KCNA, is the local equivalent of President Trump's Twitter account to produce global headlines that threaten to impact the real economies of the United States, South Korea, Taiwan, Japan, China and other global markets. The proximate heartbeat to watch in this case is the DJIA. Some observers, frightened of heights, have been warning of a crash in the Dow for many months, or even years in some cases. The technical analysis of the market has not supported their fears. Has that changed with North Korea?
The Dow chart now has three significant chart patterns and they combine to define the Dow, the strength of the longer-term uptrend and to identify support features. The first feature on the Dow chart is a long-term uptrend line. This uptrend line starts in 2011, October. Between 2011 October and 2015 August the uptrend line acted as a support level.
In 2015 August the Dow moved below the uptrend line and then in 2017 February it again moved above the trend line. The trend line is projected into the future and it will continue to act as a support level.
The second feature is the well-established trading band. The lower edge of the trading band is near 15,600. The upper edge is near 18,300. The width of the trading band is measured and then projected upwards. Calculated from 21,000 this gives a longer-term target near 23,700.
The third feature is the uptrend line starting from 2016 February. The slope of this new trend line is different from the slope of the long term uptrend line. The result is an ascending or rising wedge pattern. It is not a perfect pattern because it is interrupted by a dip below the lower trend line in 2016 November.
A rising wedge is a bearish pattern that signals a high probability that prices will collapse and head in a downward direction. As the price moves towards the apex of the pattern the momentum weakens. This has not happened and this is a bullish outcome and moves support up from 21,400. The new uptrend line now offers support near 21,550.
When these three features are combined it provides information about the way any Dow retreat will develop. There are multiple support levels that will slow and arrest any market fall.
This analysis assumes the verbal sparring does not turn into a more physical conflict. However Dow history shows that any dip is quickly followed by a rapid recovery.

Source: Bloomberg Pro Terminal
Trader - S. Fuchedzhiev
 Varchev Traders
 Read more:
 And for all the bounty hunters: Iran offers $80m for the head of Donald Trump
 US service member and 2 US Defense Dept contractors killed in Kenya attack
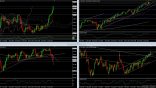 Iranian Quds leader Qasem Soleimani has been killed – how are markets reacting
 A calm end of an otherwise loud 2019
 Old but Gold – Top 5 posts of Varchev Finance
If you think, we can improve that section,
please comment. Your oppinion is imortant for us.

