

- Home
- >
- Commodities Daily Forecasts
- >
- CORN: Good level for buying

CORN: Good level for buying
Rating:

Instrument: CORN
Time Frame: D1
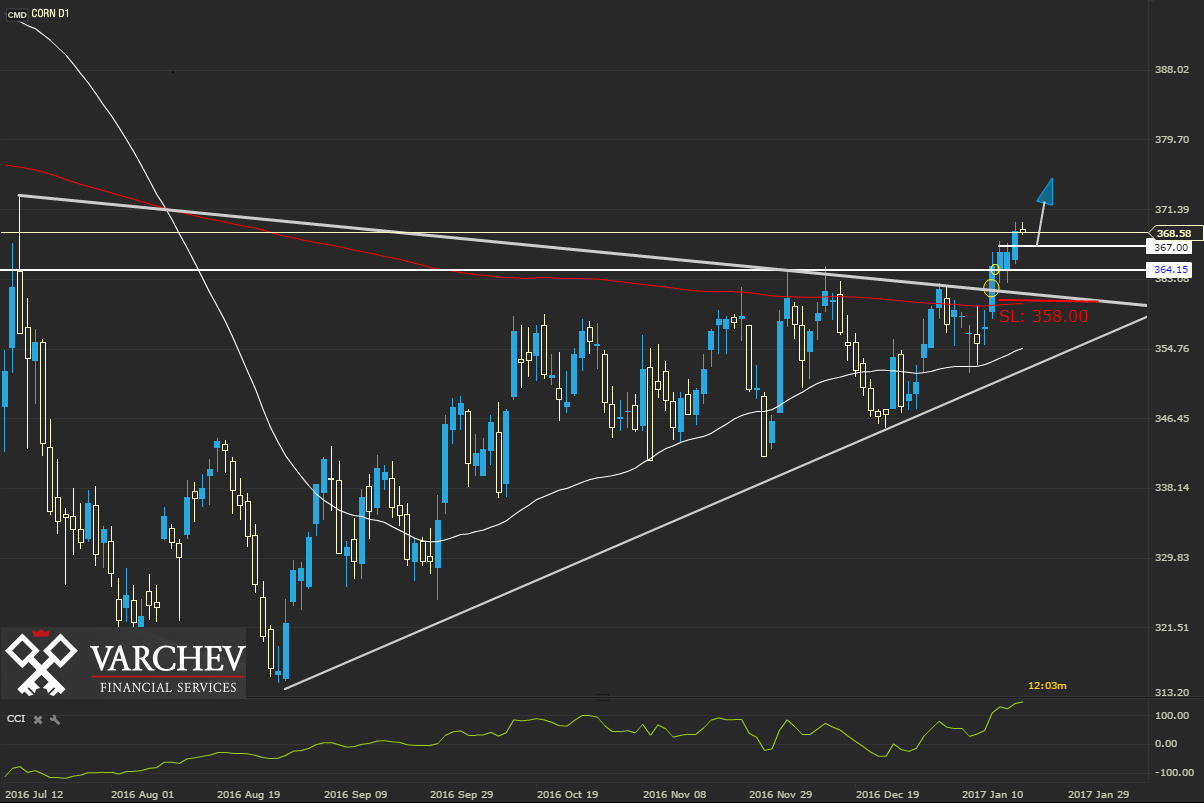
In the long run the price did test the historical bottom levels around $ 315 / $ 320 then forms a triangle that was subsequently drilled up. We have a presence and a horizontal resistance that was overcome with diagonal triangle. The price has persistently above the levels at the moment grew.
indicators:
CCI (50) is greater than 0 - movement is Long.
50SMA not yet crossed 200SMA.
Correction of the last bar of 50% will give us a better market positioning and shallower stop.
Buy Limit order price of $ 367
SL: $ 358
Alternative scenario: If the price go back in the triangle, the positive scenario for the Corn price will be broke.
Trainee_P_Milanov
 Varchev Traders
 Read more:


RECCOMEND
WAS THIS POST USEFUL FOR YOU?
If you think, we can improve that section,
please comment. Your oppinion is imortant for us.
If you think, we can improve that section,
please comment. Your oppinion is imortant for us.

