www.varchev.com

Currency chart points to bullish activity in stocks, oil

Rating:

12345
Loading...

Bank of America-Merrill Lynch sees evidence the stock market's bullish activity has near-term staying power.

And, it's using a currency chart to illustrate its case.

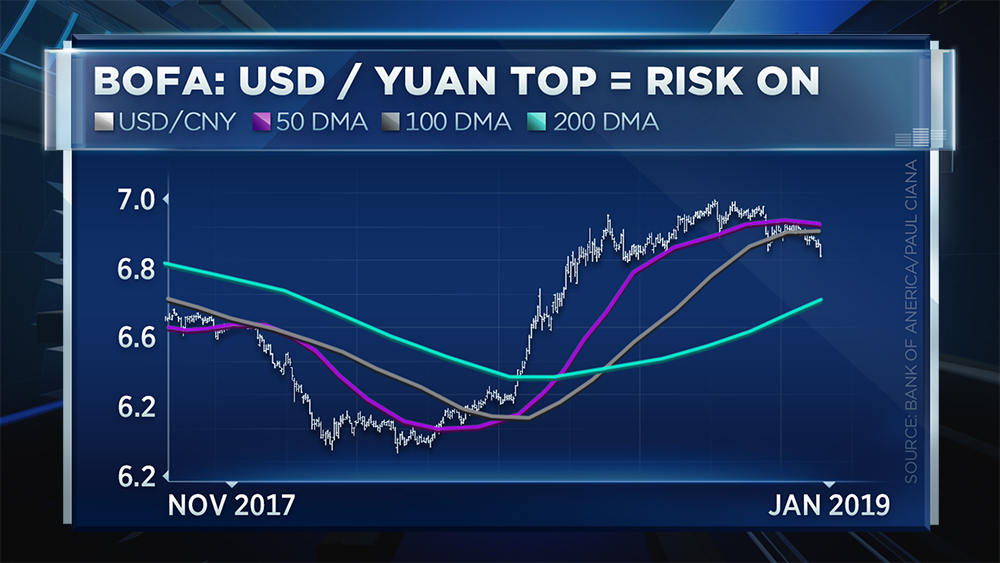
Paul Ciana, the firm's chief global technical strategist, highlighted the dollar versus the Chinese yuan on CNBC's ""Futures Now" to show the strength of "risk on" (or high-yielding, risk-sensitive) assets.

His big takeaway: The broader market rally has room to run because the dollar/yuan currency pair is in a downtrend.

"We have a technical top in the U.S. dollar versus the Chinese yuan. Now, that's a very important technical top to have because it means the dollar is weakening," he said Thursday. "The lower that the exchange rate between the U.S. dollar and the Chinese Yuan comes down, the more it is a sign, per say, that the trade agreements between the U.S. and China are going well."

The dollar versus the yuan has been trading at its weakest level since July.

"We have a nice left shoulder, head and right shoulder that formed. That neckline was broken just the other day right in here. We're now legging down not to one, but to a second new low," said Ciana.

The "risk on" rally's stamina
He noted the chart can also indicate when the rally may run out of steam. Ciana said it's one of the most common concerns he's getting from clients.

According to Ciana, the chief level to watch on his chart is 6.70 because that's when oil, treasury yields and stocks could potentially reverse at their key technical levels and resume their bearish December trend.

But for now, Ciana is in the "risk on" rally camp until there are signals that suggest the dollar/yuan is rising.

Source: CNBC


 Trader Georgi Bozhidarov

Read more:

RECCOMEND WAS THIS POST USEFUL FOR YOU?
If you think, we can improve that section,
please comment. Your oppinion is imortant for us.
WARNING: Any news, opinions, research, data or other information contained within this website is provided as general market commentary and does not constitute investment or trading advice. Varchev Finance Ltd. expressly disclaims any liability for any lost principal or profits which may arise directly or indirectly from the use of or reliance on such information. Varchev Finance Ltd. may provide information, quotes, references and links to or from other sites and blogs and other sources of economic and market information as an educational service to its clients and prospects and does not endorse the opinions or recommendations of the sites, blogs or other sources of information.
Varchev Finance

London


25 Canada Square, Level 33, office 50, Canary Wharf London, E14 5LQ +44 20 3608 6256

Universal numbers

World Financial Markets - 0700 17 600    Varchev Exchange - 0700 115 44

Varchev Finance Ltd is registered in the FCA (FINANCIAL CONDUCT AUTHORITY) with a passport in the United Kingdom: FCA, United Kingdom - registration number: 494 045, which allows provision of financial services in the United Kingdom.

Varchev Finance Ltd strictly comply with the statutes of the European directive MiFID (Markets in Financial Instruments). targeting increased efficiency, transparency and uniformity of financial instruments.
Varchev Finance Ltd is authorized and regulated by the Financial Supervision Commission - Sofia, Bulgaria: License number RG-03-02-05 / 15.03.2006

The information on this site is not intended for distribution or use by any person in any country or jurisdiction where such distribution or use would be contrary to local law or regulation.


Disclaimer:

CFDs are complex instruments and come with a high risk of losing money rapidly due to leverage. 63,41% of retail investor accounts lose money when trading CFDs with this provider. You should consider whether you understand how CFDs work, and whether you can afford to take the high risk of losing your money.

chat with dealer
chat with dealer
Cookies policy