

- Home
- >
- Trading University
- >
- Daily Fibonacci Pivot Strategy

Daily Fibonacci Pivot Strategy

Rating:

The Daily Fibonacci Pivot Strategy uses standard Fibonacci retracements in confluence with the daily pivot levels in order to get trade entries. My preferred parameters are the 38% or 50% Fibonacci levels in confluence with the daily central pivot. The examples following show entries at the 38%, 50% and 62% Fibonacci retracement levels in confluence with the daily central pivot.
As with all free forex strategies, there are many possible interpretations and variations. My particular take on this strategy is as follows:
Requirements to enter the Trade:
- The price has to be one of the following levels of Fibonacci retracement.
- We should have pivot level which coincides with the Fibonacci level or very close to it.
- And in any case wait for the formation of a reversal candle at this level before getting into the deal.
Let’s have a look at a few charts to see how this works.
The first chart shows a long entry at the confluence of the 38% Fibonacci retracement and the daily central pivot:

It was possible to enter either way here, either by buying at the first touch of that level, or waiting for the morning star candle formation to form. Both entries would have given a possible target at the 23.6%% Fibonacci extension level, which was easily reached.
The suggested stop loss for these trades is behind the Fibonacci level one level away from where you take the trade. In this case it would amount to the 50% retracement level, with a few pips extra thrown in for buffering.
The next trade shows the reverse setup of the previous trade, with a sell occurring at the confluence of the 38% retracement and the daily central pivot:

This was a nice set up given the big drop that occurred in the previous trading session. That drop signified a change in sentiment which would have added weight to the decision to sell.
This is an example of the fact that any pivot level can be used in confluence with the daily central pivot. In this case price retraced to once more retest the entry-level on the next day, but you should have had profit taken out of the trade by then, if not having exited at full profit.
Here is the way to calculate daily Pivot points.
To calculate daily pivot point (PP) have to have information for the eventual signal bar which is gated near Fibonacci level. We need the highest price of the day (H), the lowest price of the day (L) and closing price of the day (C).
The formula is as follows: PP = (H + L + C) / 3
 Varchev Traders
 Read more:
 The Amateur VS The Professional; The Difference is in The Mind
 A story of a trader: ‘Trading can take over your life – but only if you let it’
 How to Filter Good & Bad Price Action Entry Signals
 The smartest way to invest your first $1000
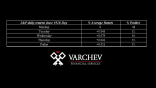 Should S&P500 be afraid from Friday 13th what the statistics look like
If you think, we can improve that section,
please comment. Your oppinion is imortant for us.

