

- Home
- >
- Stocks Daily Forecasts
- >
- DJIA: Caution the index is in sell zone

DJIA: Caution the index is in sell zone

Rating:

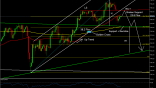
DJIA: Daily Graph, Coppy and price in the upper part of the consolation channel
Lower high and price holds below diagonal resistance.
price action: Bearish reversal candle pattern - Three inside down
CCI(50) moves below 100 - negative signal
Moving to a lower Time Frame 4H

Price is moving below diagonal support, after which test on the break and turns negative
The price of the horizontal support 17562 - strong support. Only break below it and the bar close below these levels will give us a signal for short
CCI(50) moves below 0
RSI moves below 50
Alternate Scenario:
If the price moves above 17,717 will cancel the negative formation.
Stefan D. Angelov - Head of Stocks Trading
 Varchev Traders
 Read more:


RECCOMEND
WAS THIS POST USEFUL FOR YOU?
If you think, we can improve that section,
please comment. Your oppinion is imortant for us.
If you think, we can improve that section,
please comment. Your oppinion is imortant for us.

