

- Home
- >
- Stocks Daily Forecasts
- >
- Don’t sell the bull trend and don’t buy the bear

Don't sell the bull trend and don't buy the bear
Rating:

This is the reality of all markets, whether bearish or bullish that the correction is happening. If someone follows the "do not sell bullish trend and do not buy bearish" rule, it is crucial that you have a proven way of identifying the underlying trend and when markets are fundamentally turning their course. This article discusses how linear and logarithmic methods to determine the underlying trend can give an early turn signal in the main movement.
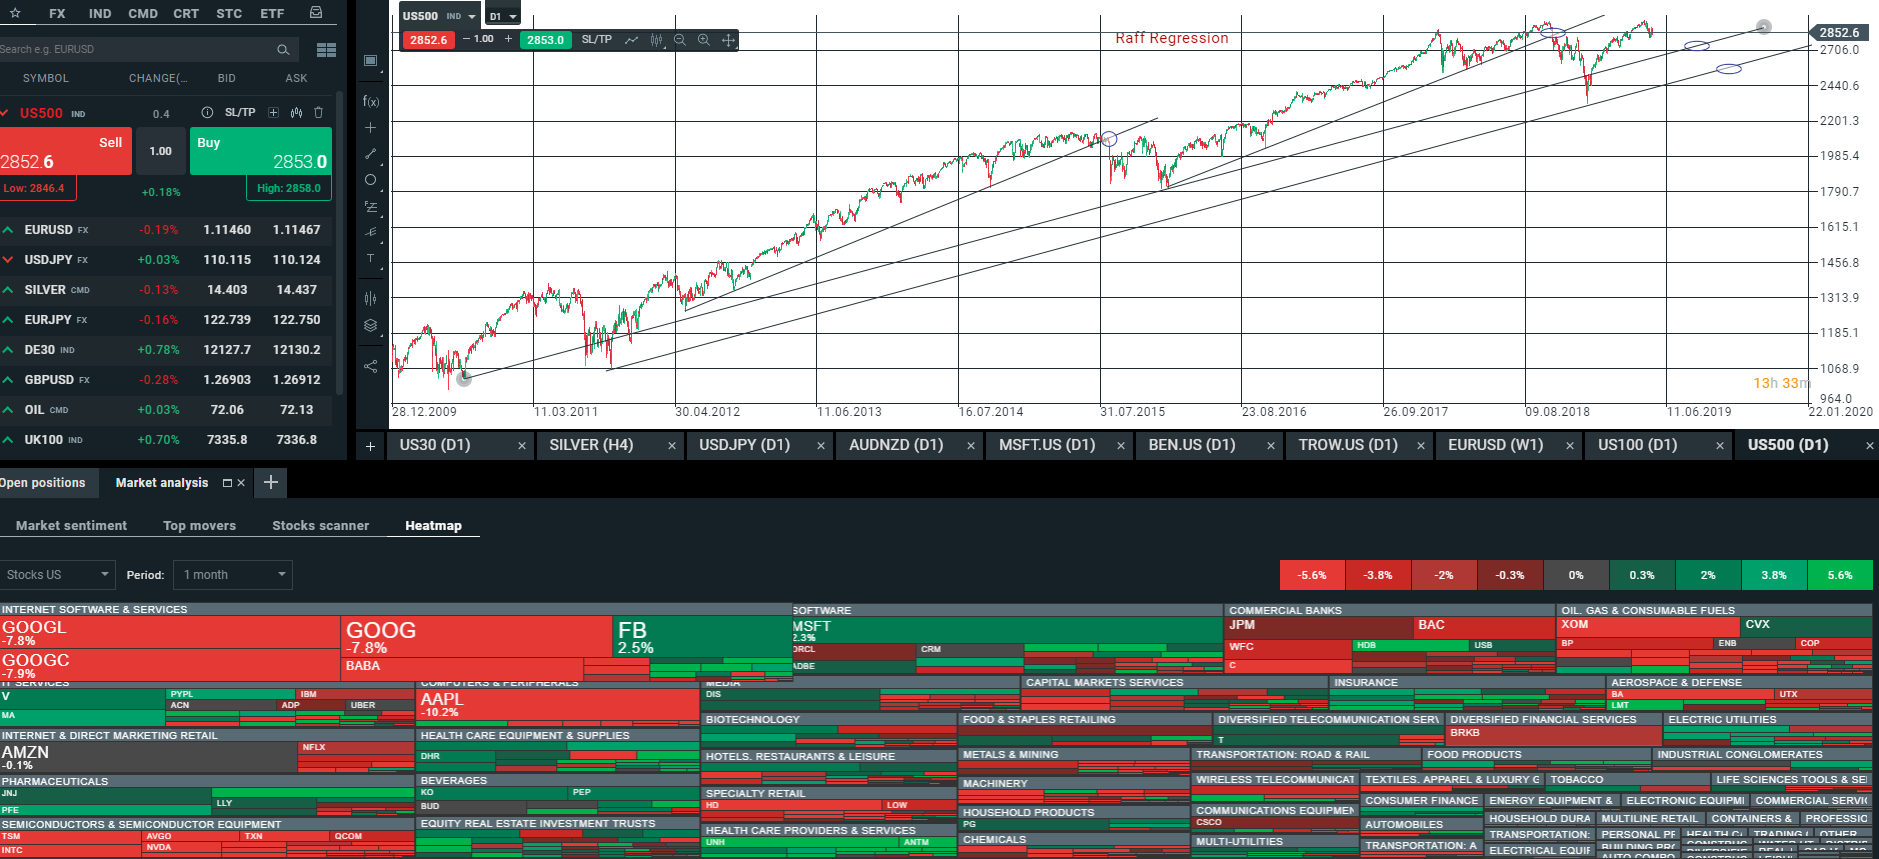
After September 2018, the markets provide investors with huge free falls, followed by sharp rises. It is important for this reason to take a step backwards and remember that the main trend of this phenomenal bullish market has not changed. There are two ways to do this: by looking at the data on a linear scale, or by using it exponentially (logarithmically). The linear basic trendline is just a support plotted by the local minimum, and the logarithmic is a more complex structure called Raff Regression.
The following charts represent a linear and logarithmic technical analysis of Nasdaq Composite.


At the moment, the index remains above its two main backs, so to talk about the end of the bullish trend is illogical and haste.
In the case of the S & P 500, the situation is similar to the one discussed above - the index remains above its backers. As a rule, if any line breaks, it will signal attention and cause a reduction in long positions. For the moment, however, we are far from such a case.


To be successful on the stock market, investors must be able to determine when the underlying movement is changing. A breakthrough of any of the trendlines discussed in this post is a signal that points to a change in direction.
In the 2018 correction, the analyzes showed that there was no end to the main trend. As a result, long positions have been preserved and still are.
 Trader Aleksandar Kumanov
 Read more:
 US – Iran – Iraq tension remain the main driver of the stock market today
 How top market players on Wall St think 2020 will look like on financial markets
 Money Flow before the start of the new trading week
 Cincinnati Financial Corporation (CINF.US) -Opportunity for long positions
 Asia stocks gain as Fed signals no rate cuts in 2020
If you think, we can improve that section,
please comment. Your oppinion is imortant for us.

