

- Home
- >
- Daily Accents
- >
- Equities At All-Time Highs But Investors Remain Pessimistic, expect correction

Equities At All-Time Highs But Investors Remain Pessimistic, expect correction

Rating:

US equities are trading at all-time highs. The trend is higher, supported by strong breadth, resilient economic data and improved corporate financials. Even after the strong advance, longer term measures of sentiment continue to show skepticism among investors.
There are reasons to be on the alert for a retracement of recent gains in August. The SPX consistently reacts negatively as it approaches each "round number" milestone (like 2200) for the first time. NDX has returned to its late 2015 resistance level. Some measures of shorter sentiment are heady. And August is seasonally weak and prone to a larger interim drawdown. Importantly, none of this is likely to be trend-ending. If indices turned on red, there will be a price action signal for a possible correction.
The rally indicates that the current trend will continue although there is a possibility for a correction before that
Firstly: First, the SPX is now trading at a new all-time high (ATH). On its own, this should be considered a bullish confirmation of trend. Since 1950, when the SPX makes a new high after not having done so in the past year, the index has added to those gains more than 80% of the time in the next 3 months and 100% of the time in the next year.

It is fair to say that the push to new highs in equities is supported by resilience in the macro data. New house sold in the US reached a new 8 year high in June. Home sales and construction are an important driver of employment and consumption; prior to a recession, the pattern has been for housing to cool/decline.

Retail sales, similarly, are at an ATH and not showing any pre-recessionary flattening or weakness.
Not only has employment growth of approximately 2% YoY persisted but wage growth has accelerated. Taken together, higher incomes for an increasing number of households should continue to fuel consumption.

It's also fair to say that new highs in equity prices are supported by an improvement in corporate sales and profit growth. It's still early in the 2Q16 reporting season but earnings are tracking growth of 7% YoY and 17% QoQ.

Given the advance in stock prices, together with decent macro and financial data, it is surprising how pessimistic investors remain, at least on a longer term basis.
Money flows into equity ETF and mutual funds have been negative 13 of the past 14 weeks, including 3 of the past 4 weeks since the Brexit vote. Money flows have been negative longer than any time during the 2007-09 bear market. Even the bear market rally in March-May 2008 included several positive weeks of equity inflows, including one that was more than $20b in one week. There has been nothing close to this during 2016 and it is hard to imagine this uptrend running into significant trouble until it does

US stock are traded at record highs. The trend is positive, supported by resilient economic data and improved corporate finance. Even after the strong rise, the long-term sentiment indicators continue to show skepticism among investors. Therefor we expect a correction of the stock indices in the US because of the market sentiment .
 Varchev Traders
 Read more:
 And for all the bounty hunters: Iran offers $80m for the head of Donald Trump
 US service member and 2 US Defense Dept contractors killed in Kenya attack
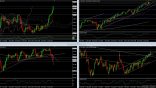 Iranian Quds leader Qasem Soleimani has been killed – how are markets reacting
 A calm end of an otherwise loud 2019
 Old but Gold – Top 5 posts of Varchev Finance
If you think, we can improve that section,
please comment. Your oppinion is imortant for us.

