

- Home
- >
- FX Daily Forecasts
- >
- EUR / JPY: Opportunities for short positions

EUR / JPY: Opportunities for short positions
Rating:

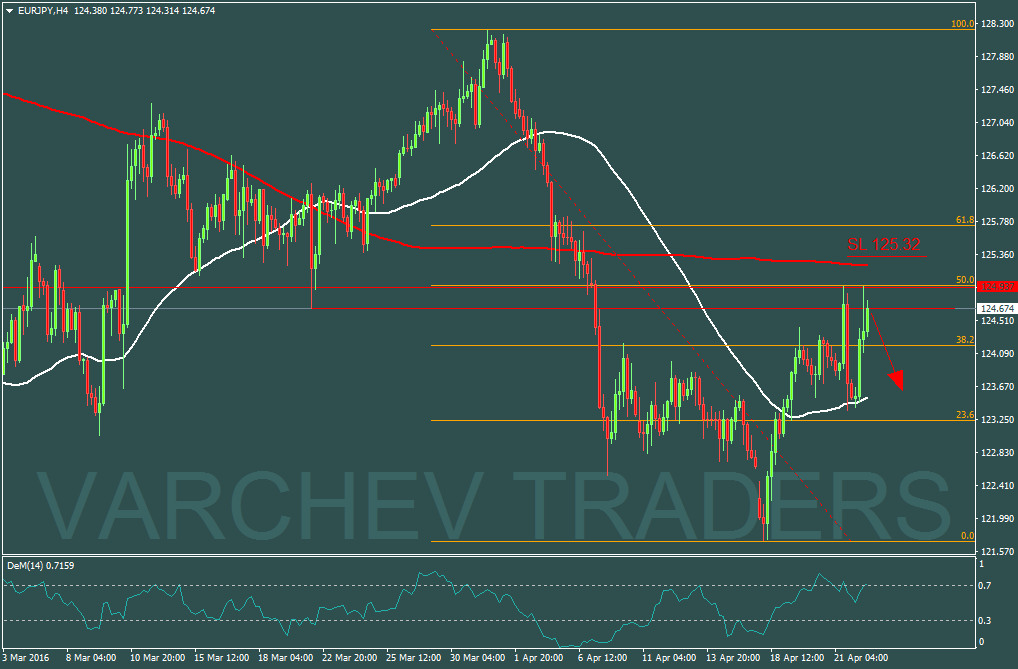
EUR / JPY: Daily graphics - downtrend, 4h. graphics correction to levels of horizontal resistance
Fibonacci correction up to 50% of the last down movement
Price on horizontal resistance 124.674
price action: Inverted pin bar of resistance - negative formation, which is a reversal of short-term movement
Price correcting 50% of the last bar, which gives us a good place to market positioning.
indicators:
50 / 200MA - 50 under 200 which is a negative signal, price below 200MA
DeM is at 0.7
SL: 125.32
Alternative scenario: Crossing the price above horizontal resistance and 200MA will break the negative trend and is likely to see an increase in price.
Jr_Trader_I_Ivanov
 Varchev Traders
 Read more:
 FX expiring options today 22.02.2019
 AUD at key technical levels, but the data for China weighs on the fundament
 Bloomberg survey expect the negative sentiment for USD to remain in 2018
 A lack of confidence and the longer-term prospects are holding the dollar back
 Net speculative positions of CFTC as of 19.12.2017
RECCOMEND
WAS THIS POST USEFUL FOR YOU?
If you think, we can improve that section,
please comment. Your oppinion is imortant for us.
If you think, we can improve that section,
please comment. Your oppinion is imortant for us.

