

- Home
- >
- FX Daily Forecasts
- >
- EUR / USD: buy signal from DeM sequential

EUR / USD: buy signal from DeM sequential
Rating:

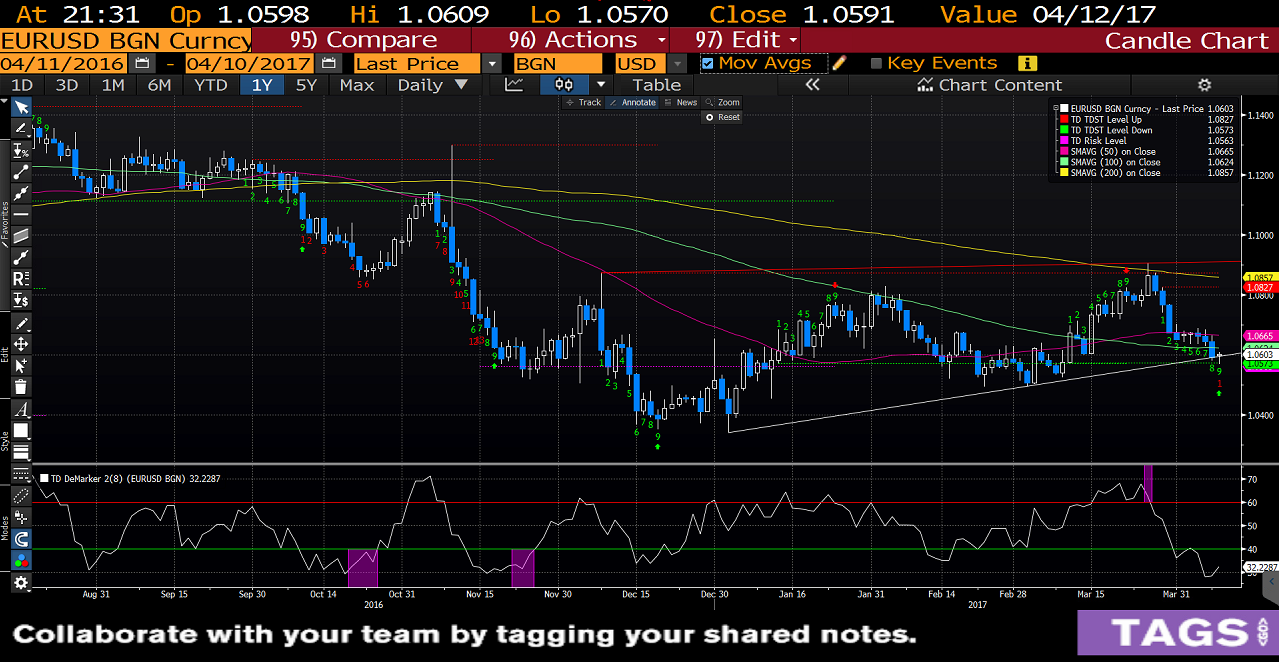
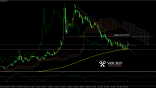
DеM sequential: formation of the numbers 9 and 13 in DEM sequential on a daily chart, gives a signal for possible reversal of the direction of the price
EUR / USD: Daily graphics - we see high peaks and lower bottoms
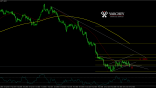
Price above the diagonal support
Price Action: If the daily bar ended without change, this will be a "Pin bar" which is a positive signal
indicators:
DEM: Rotates from zone of over sold market - bullish signal
DEM Successively signaled by number 9 - signal for possible bullish movement
SL: 1.0545
Alternative scenario: If the price move below the support and hold below, this will spoil the positive formation and short-and will be more likely.
 Varchev Traders
 Read more:
RECCOMEND
WAS THIS POST USEFUL FOR YOU?
If you think, we can improve that section,
please comment. Your oppinion is imortant for us.
If you think, we can improve that section,
please comment. Your oppinion is imortant for us.

