

- Home
- >
- FX Daily Forecasts
- >
- EUR / USD: movements in the last two weeks and what to expect

EUR / USD: movements in the last two weeks and what to expect
Rating:

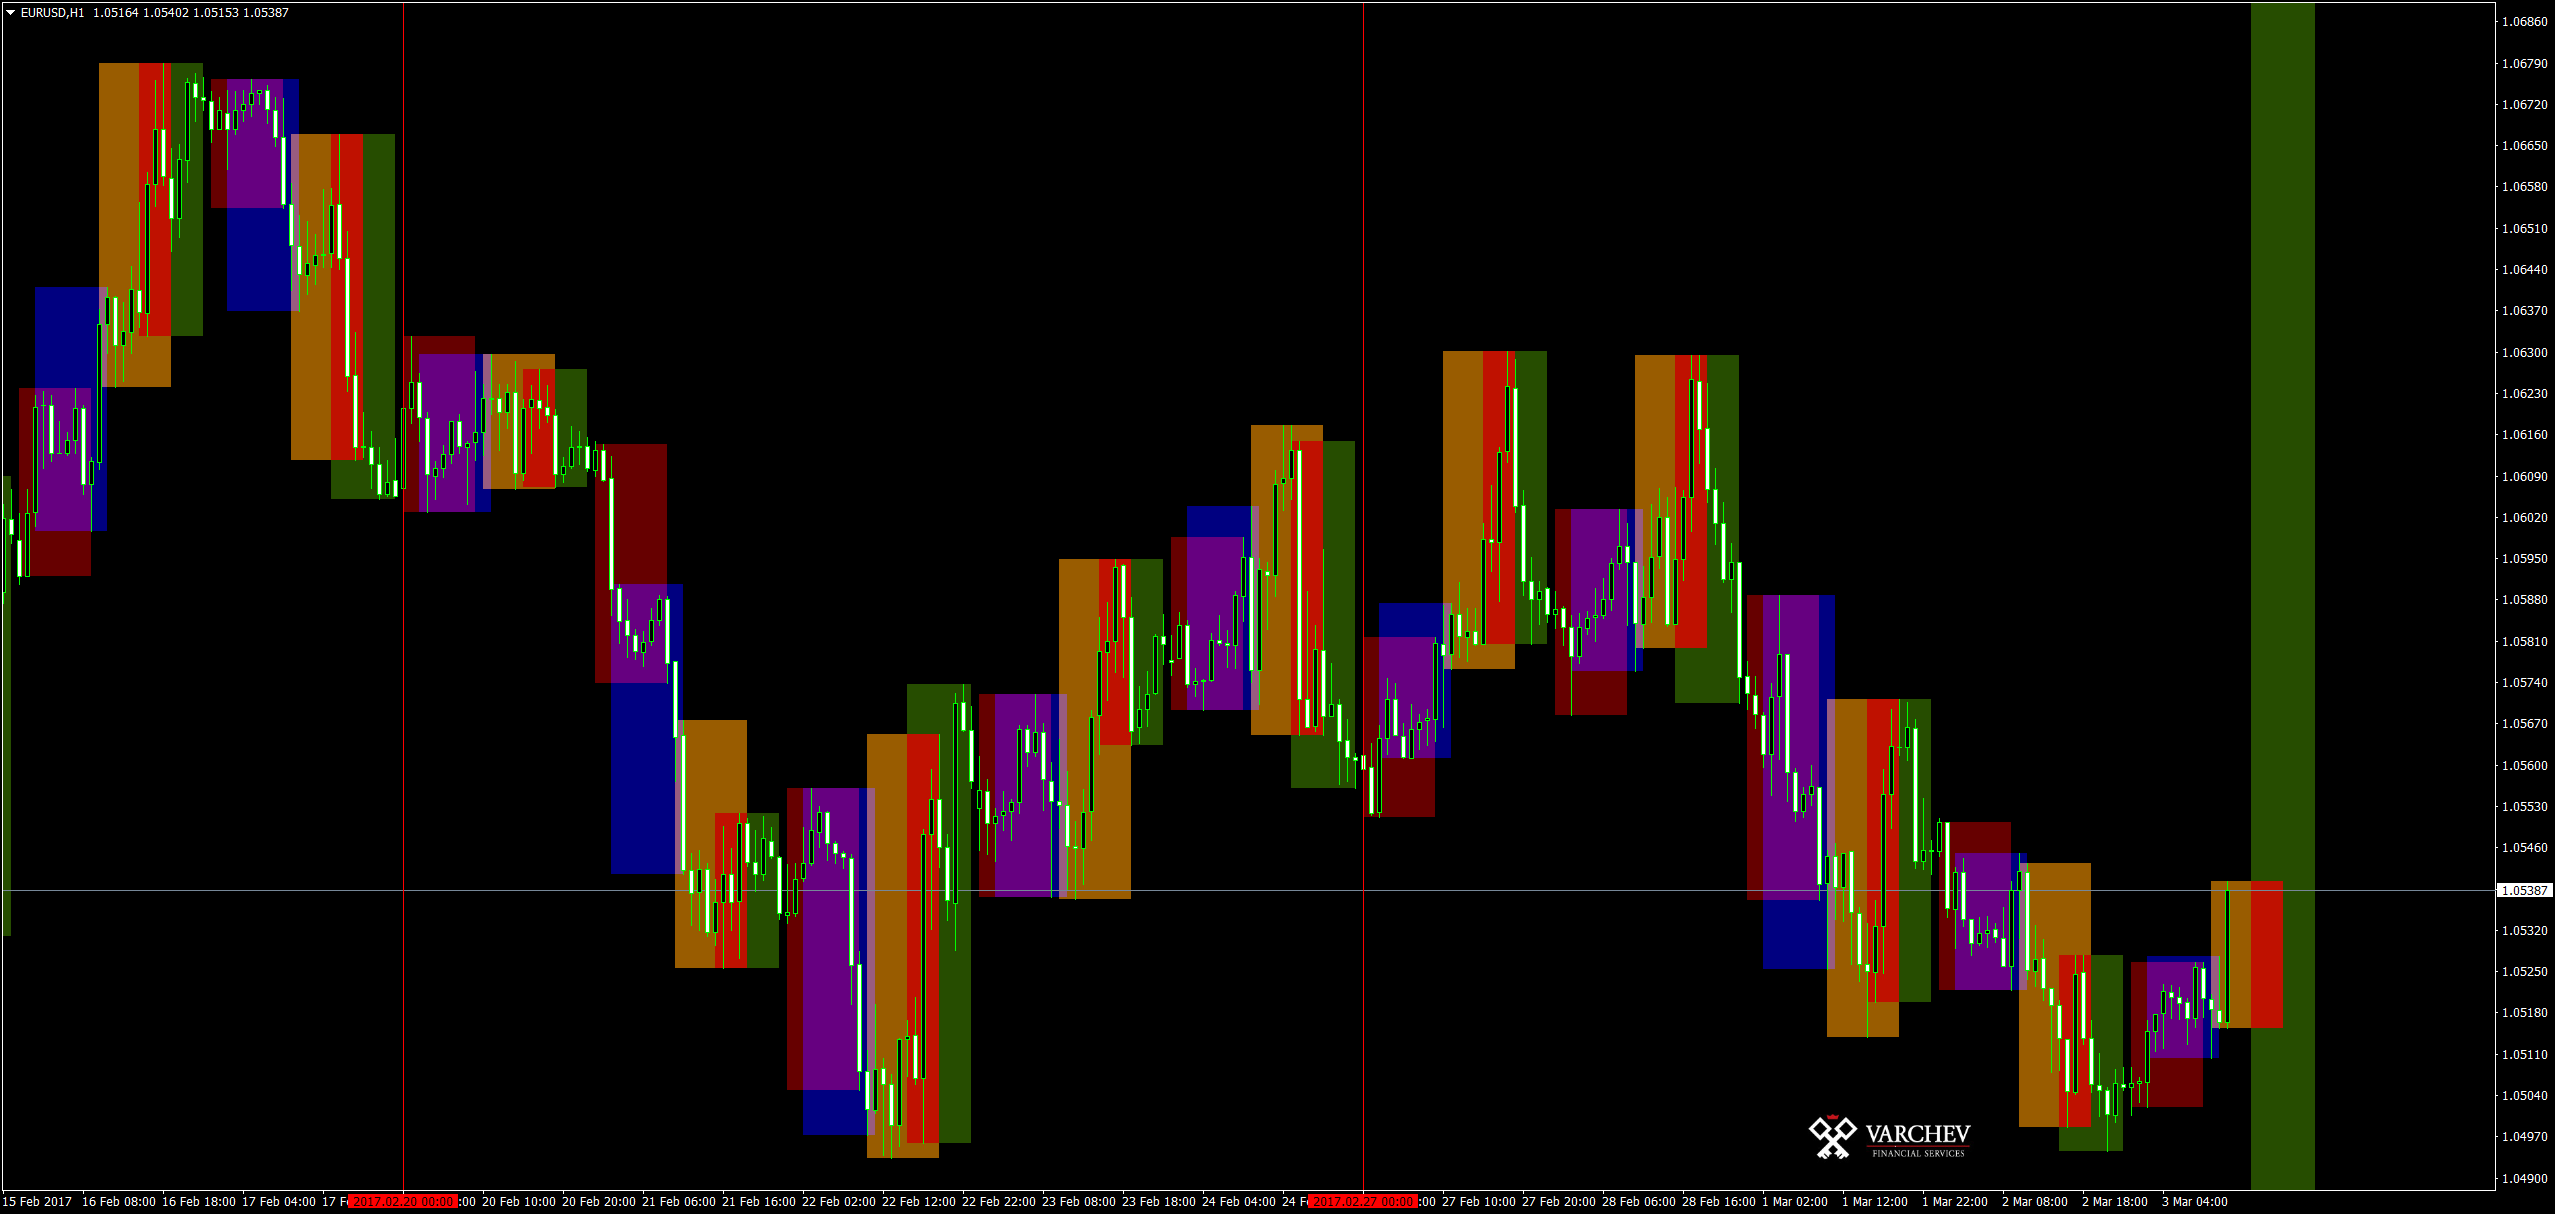
The graph expressed all trading sessions in the world and how they affect trade in EUR / USD over the past two weeks.
With dark red color depicts the session in Sydney, Australia. Blue is depicted trading session in Tokyo, Japan. Orange represents the time trading in Europe, while green shows The US trading session.
Detection time trading of US and European market is displayed on a graph with a bright red color.
Last week Thursday and Friday reflect well on the currency pair and the price grew to the opening of the US, then decline sharply. Today we see similar scenarios at the time the price of the euro is rising. If the mood in the last two weeks we can be an indicator, today we can expect the same development cost.
 Varchev Traders
 Read more:
 EUR/CHF – Sells seems to be the best trade
 EUR/USD: sentiment and technical analysis
 The breaking point for EUR/USD, the winners from Brexit: European session today (28.08.2018)
 EUR/JPY – Technically and fundamentally, the growth seems more likely
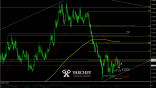 J. Powell optimist about the US economy, USD stay under pressure
RECCOMEND
WAS THIS POST USEFUL FOR YOU?
If you think, we can improve that section,
please comment. Your oppinion is imortant for us.
If you think, we can improve that section,
please comment. Your oppinion is imortant for us.

