

- Home
- >
- FX Daily Forecasts
- >
- EUR / USD: Opportunities for short-term long positions

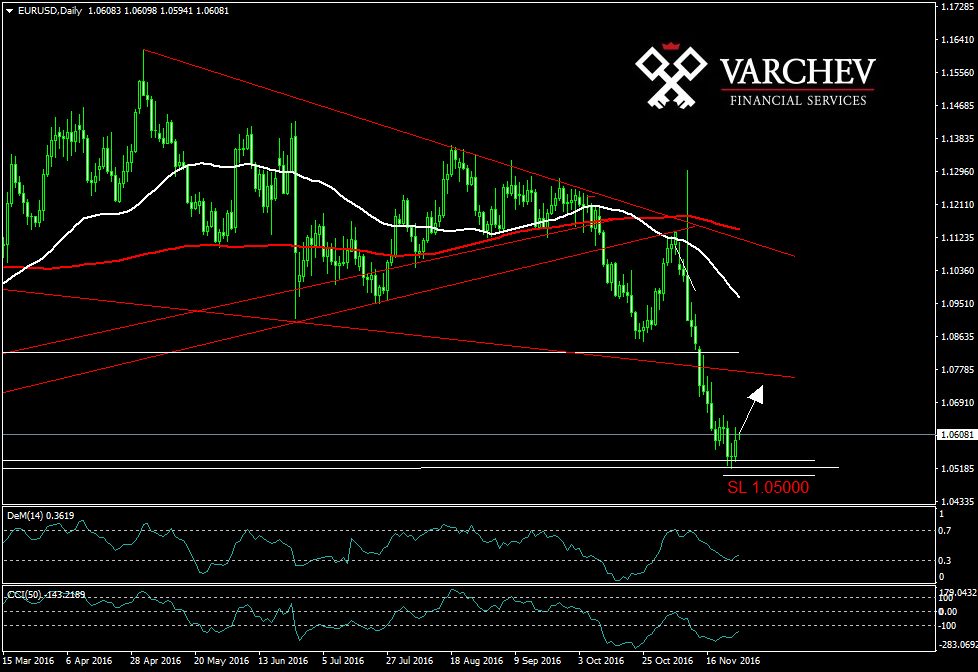
EUR / USD: Opportunities for short-term long positions
Rating:

EUR / USD: Daily chart - long chopi
Price horizontal support
Price Action: Doji and higher peak to the next bar - a possible upward adjustment
indicators:
50/200 MA - do not give clear signals
DEM: remained above 0.3 and makes divergence - possible to place growth
CCI (50) rotates in an area of over sold market - a positive signal
SL: 1,05000
Alternative scenario: If the price crosses below the horizontal support we might see another bearish momentum.
Jr_Trader_I_Ivanov
 Varchev Traders
RECCOMEND
WAS THIS POST USEFUL FOR YOU?
If you think, we can improve that section,
please comment. Your oppinion is imortant for us.
If you think, we can improve that section,
please comment. Your oppinion is imortant for us.

