

- Home
- >
- FX Daily Forecasts
- >
- EUR/AUD: Again short after retest of the break

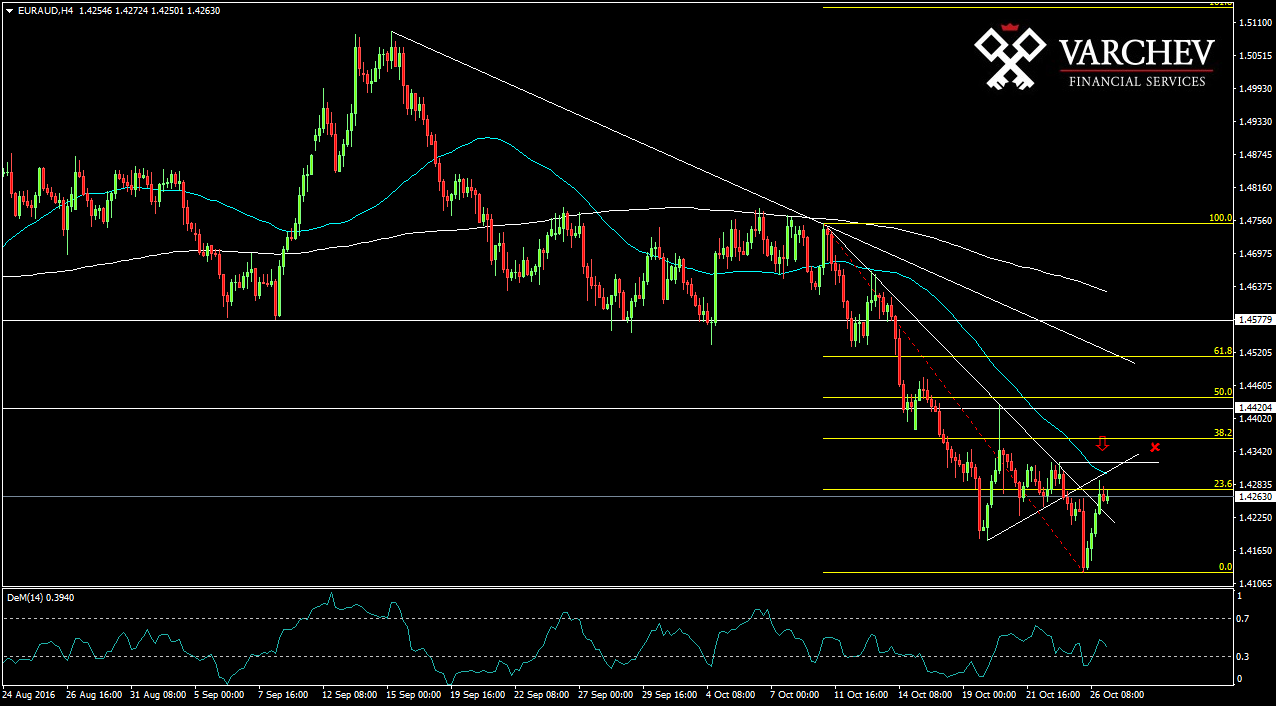
EUR/AUD: Again short after retest of the break
Rating:

EUR/AUD:
Date: 27 October, 2016
H4 Graph: Short Trend
The price made a flag for a short move with the trend and broke below and continued down. Now the price came back for a possible retest of the break of the diagonal support, now resistance. Here there is a second diagonal resistance and horizontal resistance. Also Fibo level of 23,6%. The price continue to make lower lows.

Alternative Scenario: If the price break up again above the both diagonal resistances, this will cancel the bearish view.
Technical Indicator
DEM (14) - Turned down
Price for Entry short around: 1.42750
SL: 1.43350
Jr. Trader - S. Fuchedzhiev
 Varchev Traders
RECCOMEND
WAS THIS POST USEFUL FOR YOU?
If you think, we can improve that section,
please comment. Your oppinion is imortant for us.
If you think, we can improve that section,
please comment. Your oppinion is imortant for us.

