

- Home
- >
- FX Daily Forecasts
- >
- EUR/AUD: Two equal Highs – Possible signal for short

EUR/AUD: Two equal Highs - Possible signal for short
Rating:

EUR/AUD:
Date: 13 October, 2016
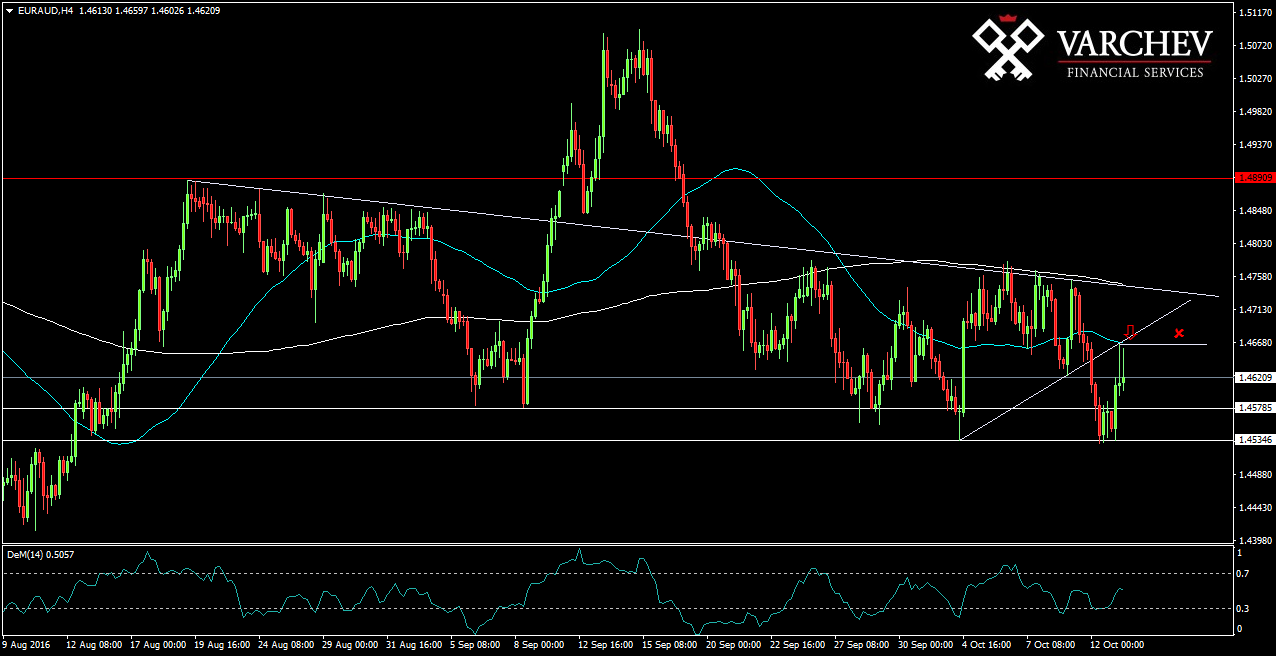
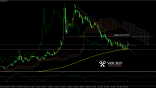
H4 Graph: Medium term Choppy, Short term short
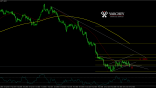
The price tests the lower boundary of the range, in which has been trading at 1.45350. Then the price moved up, but it stops and creates these two bars with equal shadows, which might be a signal for short from here. This might happen if the bars close as they are at 12:00
Price Action: Two equal highs - Possible stignal for short

Alternative scenario: If the price moves higher than the two shadows, this will cancel the bearish view.
Technical Indicator:
DEM (14) - Still not in the oversold zone
Price for Entry short: After the bar closes at 12:00
SL: 1.46800
Jr. Trader - S. Fuchedzhiev
 Varchev Traders
 Read more:
RECCOMEND
WAS THIS POST USEFUL FOR YOU?
If you think, we can improve that section,
please comment. Your oppinion is imortant for us.
If you think, we can improve that section,
please comment. Your oppinion is imortant for us.

