

- Home
- >
- FX Daily Forecasts
- >
- EUR/GBP: Good place for new long, after correction down to strong support level

EUR/GBP: Good place for new long, after correction down to strong support level
Rating:

EUR/GBP:
Date: 27 September, 2016
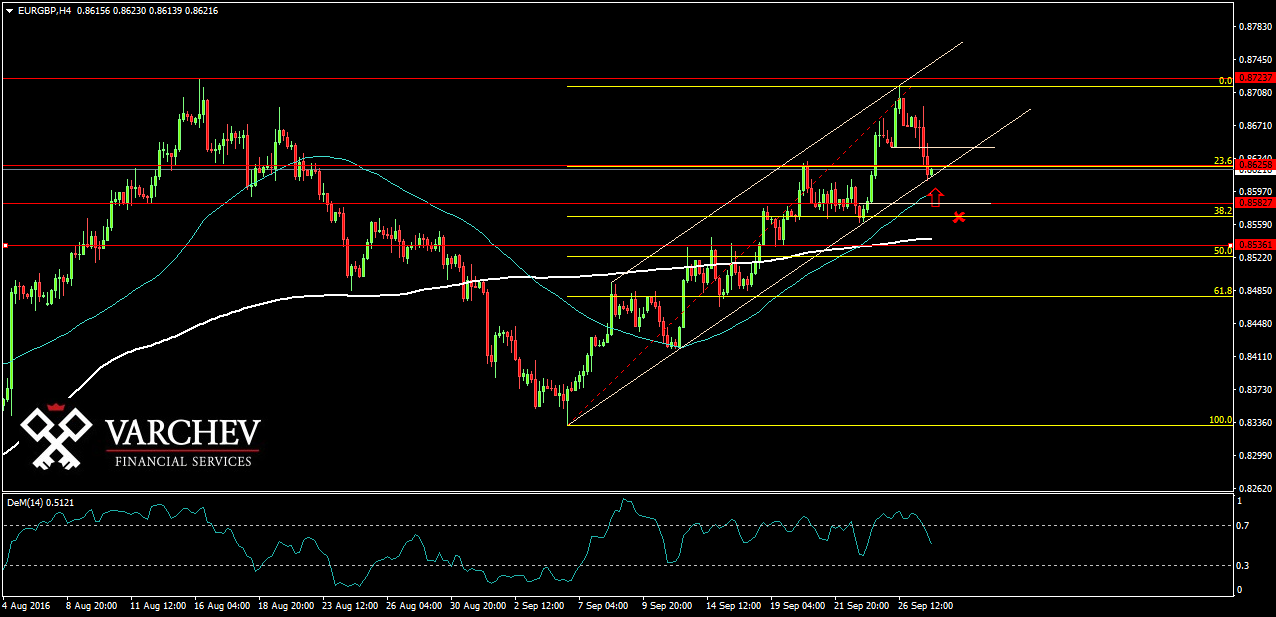
H4 Graph: Long Trend
The price is going up in a visible price bullish channel. After the price reached the previous top at 0.87200, the price made a correction down to horizontal and diagonal support. Fibo 23,6% and 50 МА is above the 200 МА.

Alternative scenario: If the price breaks down below the horizontal and diagonal support this will cancel this scenario
Technical Indicator:
DEM (14) - In the middle of the range pointing down, but indicators follow price and not the opposite
Price for Entry long around: 0,86150
SL: 0.85750
Jr. Trader - S. Fuchedzhiev
 Varchev Traders
 Read more:
 EUR/CHF – Sells seems to be the best trade
 EUR/USD: sentiment and technical analysis
 The breaking point for EUR/USD, the winners from Brexit: European session today (28.08.2018)
 EUR/JPY – Technically and fundamentally, the growth seems more likely
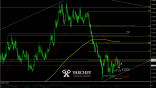 J. Powell optimist about the US economy, USD stay under pressure
RECCOMEND
WAS THIS POST USEFUL FOR YOU?
If you think, we can improve that section,
please comment. Your oppinion is imortant for us.
If you think, we can improve that section,
please comment. Your oppinion is imortant for us.

