

- Home
- >
- Uncategorized @en
- >
- EUR/GBP: Long is again possible, after end of the current correction

EUR/GBP: Long is again possible, after end of the current correction
Rating:

EUR/GBP
Date: July 13, 2016
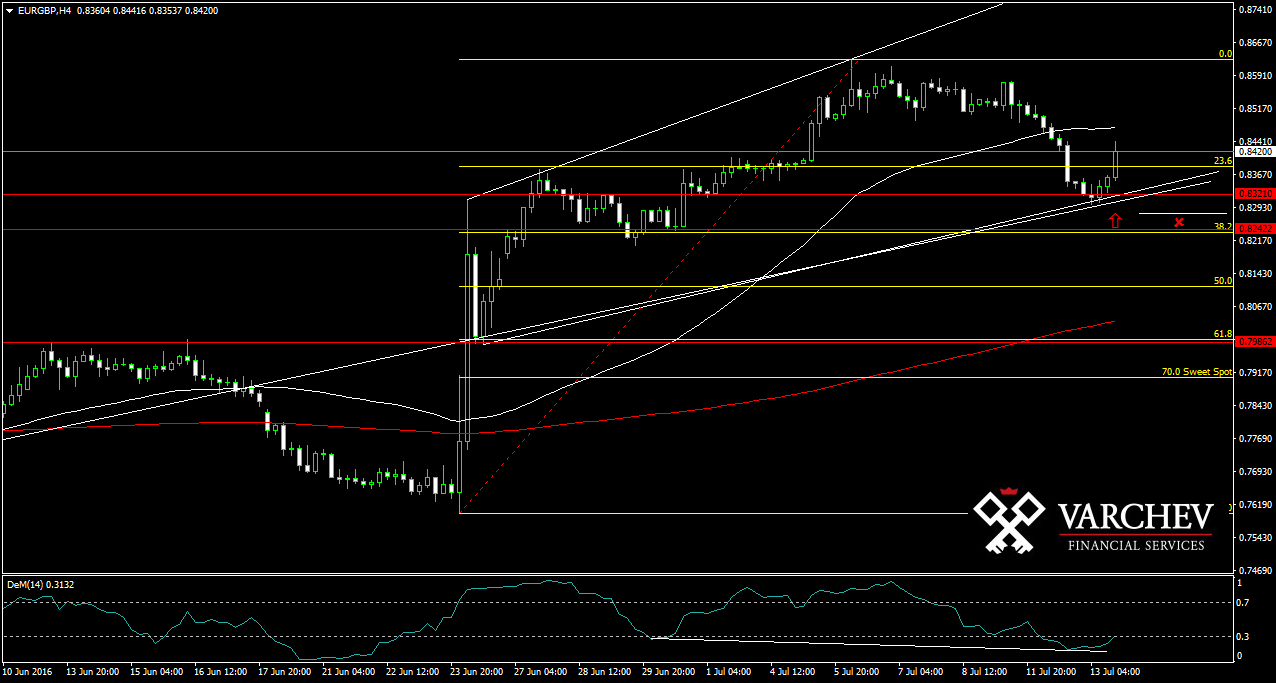
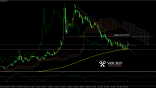
H4 Graph: Long Trend
The price has made a correction down to horizontal support. Still the price kept its up trend exposure within the Bullish up channel. FIB between 23%- 38,2%
Price Action: Doji formation at a level of diagonal and horizontal support
Divergence of the technical indicator Demarker

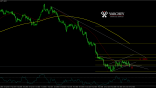
Alternative scenario: If the price moves aggressively down below the diagonal and horizontal supports will cancel the bullish view
Technical Indicator
DEM (14) - In oversold zone. Divergence for long
Price for Entry long around: 0,8380 - 50% of the previous bullish bar in order to have a smaller SL
SL: 0.82800
Jr. Trader - S. Fuchedzhiev
 Varchev Traders
 Read more:
RECCOMEND
WAS THIS POST USEFUL FOR YOU?
If you think, we can improve that section,
please comment. Your oppinion is imortant for us.
If you think, we can improve that section,
please comment. Your oppinion is imortant for us.

