

- Home
- >
- FX Daily Forecasts
- >
- EUR/GBP: Possible long by the trend from diagonal support

EUR/GBP: Possible long by the trend from diagonal support
Rating:

EUR/GBP:
Date: 21 November, 2016
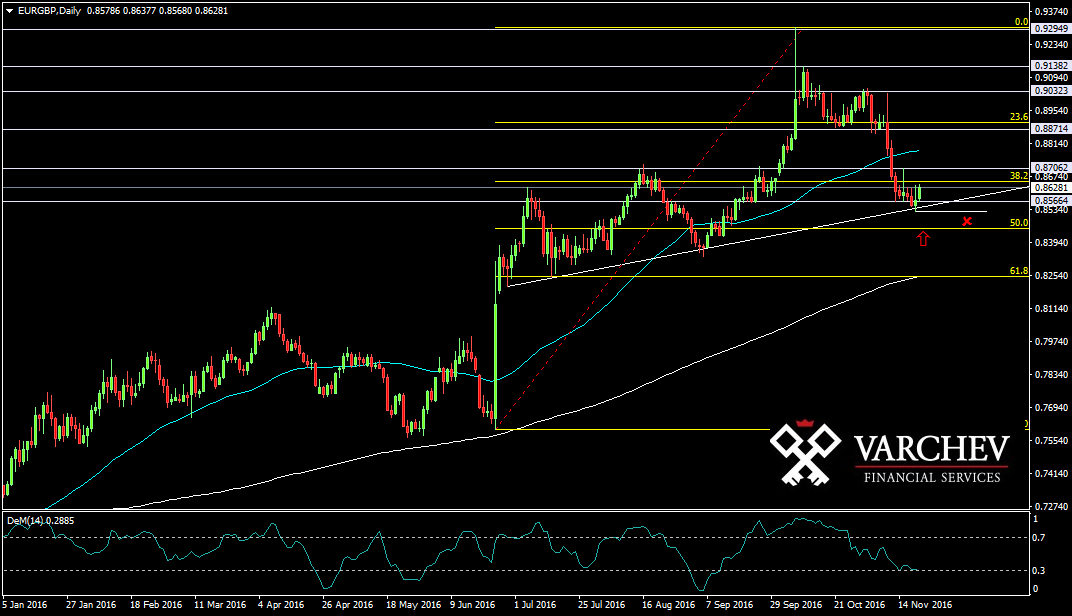
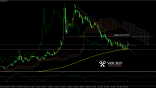
D1 Graph: Long Trend
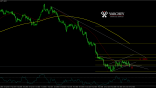
The price made a correction and stopped at diagonal support and horizontal support at 0.85600. Price remains above 200 EMA and in between Fib levels of 38.2% and 50%.
Price Action: Pin bar at horizontal and diagonal supports - possible signal for long

Alternative scenario: If the price starts going lower again and breaks below the previous low of 0.85300 and below the diagonal support, this will cancel the scenario.
Technical Indicator:
DEM (14) - close to the oversold zone
Price for Entry long around: 0.8600
SL: 0.85200
Jr. Trader - S. Fuchedzhiev
 Varchev Traders
 Read more:
RECCOMEND
WAS THIS POST USEFUL FOR YOU?
If you think, we can improve that section,
please comment. Your oppinion is imortant for us.
If you think, we can improve that section,
please comment. Your oppinion is imortant for us.

