

- Home
- >
- FX Daily Forecasts
- >
- EUR/GBP: Short move to continue after re-test

EUR/GBP: Short move to continue after re-test
Rating:

EUR/GBP:
Date: May 25, 2016
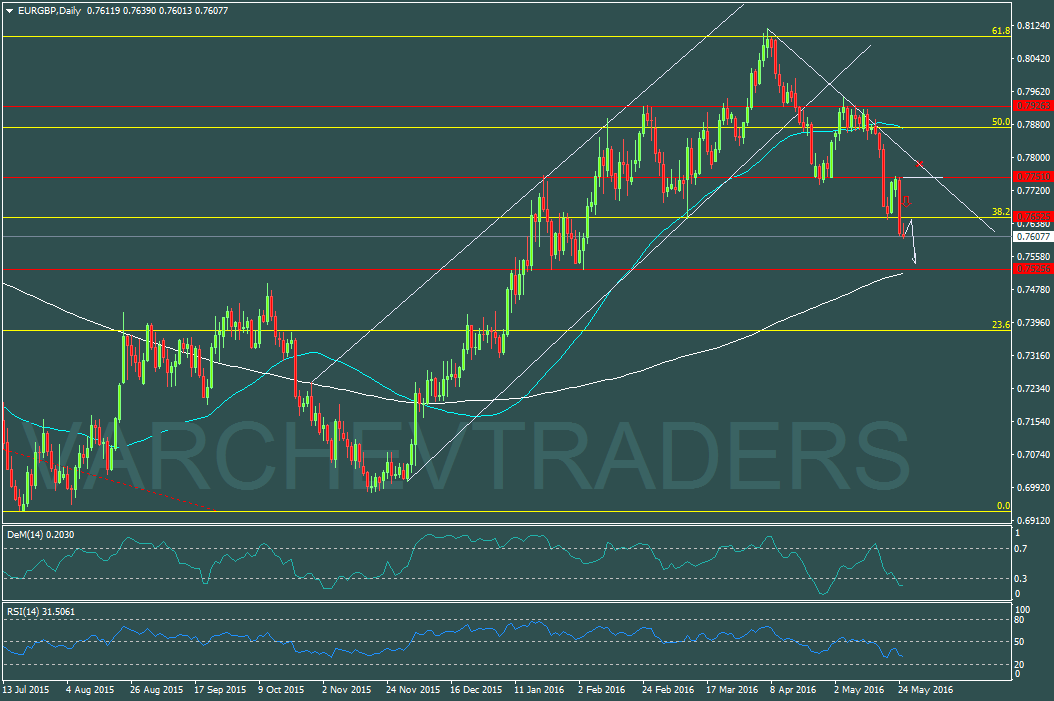
D1 Graph: Medium term short move
Price has reached FIB 61,8% on W1, then price falls and breaks down a horizontal support at 0.773/0.7750. The move lower continue and breaks another horizontal support at 0.76500. Re-test on this last level of which was support and now resistance and to continue lower.

Alternate scenario: if the price moves up above 0.7755, this will cancel the bearish view.
Technical indicators:
DEM (14) D1 - In oversold zone
RSI (14) D1 - is below 50
Price for Entry short around: The closer to 0.76500 the better
SL: 0.77550
Jr. Trader - S. Fuchedzhiev
 Varchev Traders
 Read more:
 EUR/CHF – Sells seems to be the best trade
 EUR/USD: sentiment and technical analysis
 The breaking point for EUR/USD, the winners from Brexit: European session today (28.08.2018)
 EUR/JPY – Technically and fundamentally, the growth seems more likely
 J. Powell optimist about the US economy, USD stay under pressure
RECCOMEND
WAS THIS POST USEFUL FOR YOU?
If you think, we can improve that section,
please comment. Your oppinion is imortant for us.
If you think, we can improve that section,
please comment. Your oppinion is imortant for us.

