

- Home
- >
- FX Daily Forecasts
- >
- EUR/JPY : break under 122.00, short will probably continue

EUR/JPY : break under 122.00, short will probably continue
Rating:

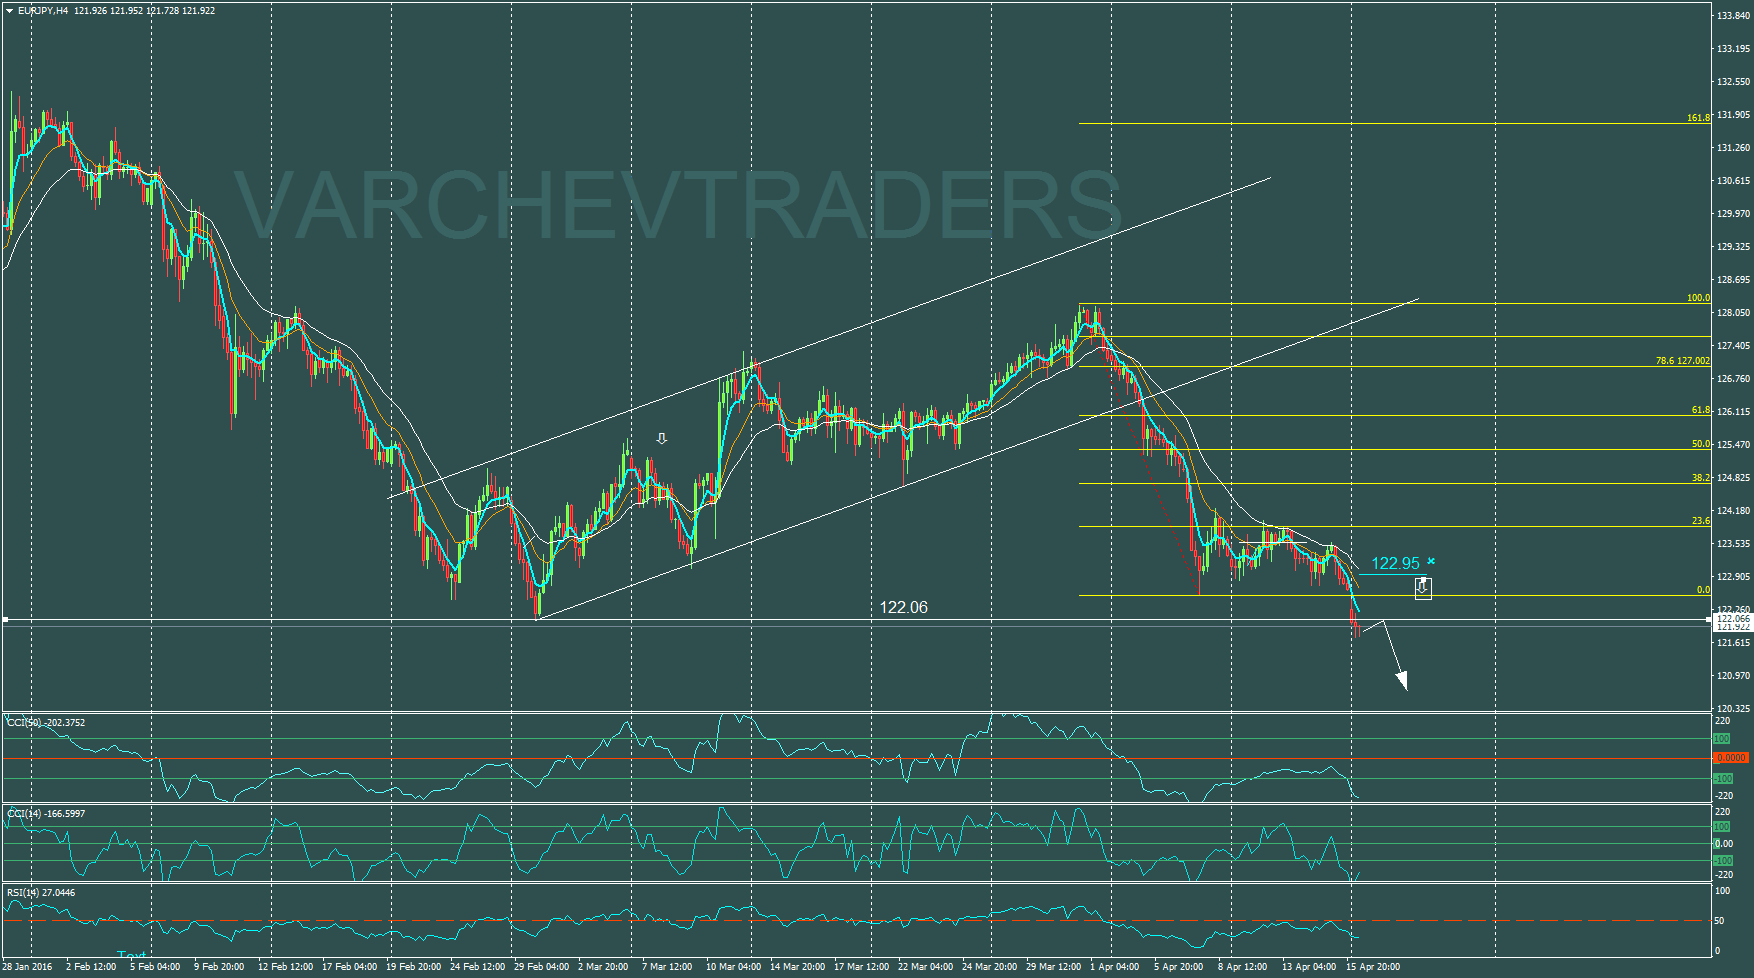
EUR/JPY: 4 H downtrend
Break below horizontal support and two closed bars under this level below 122.06.
Lower bottom, price below moving averages in a bearish formation.
Indicators:
CCI(50) below -100 - strong negative signal
RSI under 0, price below 25 ЕМА
Despite negative sentiment, entry after a little correction at least around 122, so we can place stop loss over the gap or even one bar before the gap.
SL: 122.95
Alternative scenario: If price goes over 25 EMA, over 122.95 that would break the negative formation.
Stefan D. Angelov - Head of Stocks Trading
 Varchev Traders
Read more:
 EUR/CHF – Sells seems to be the best trade
 EUR/USD: sentiment and technical analysis
 The breaking point for EUR/USD, the winners from Brexit: European session today (28.08.2018)
 EUR/JPY – Technically and fundamentally, the growth seems more likely
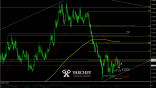 J. Powell optimist about the US economy, USD stay under pressure
RECCOMEND
WAS THIS POST USEFUL FOR YOU?
If you think, we can improve that section,
please comment. Your oppinion is imortant for us.
If you think, we can improve that section,
please comment. Your oppinion is imortant for us.

