

- Home
- >
- FX Daily Forecasts
- >
- EUR/JPY: Good place for longs after correction at support

EUR/JPY: Good place for longs after correction at support
Rating:

EUR/JPY:
Date: 8 September, 2016
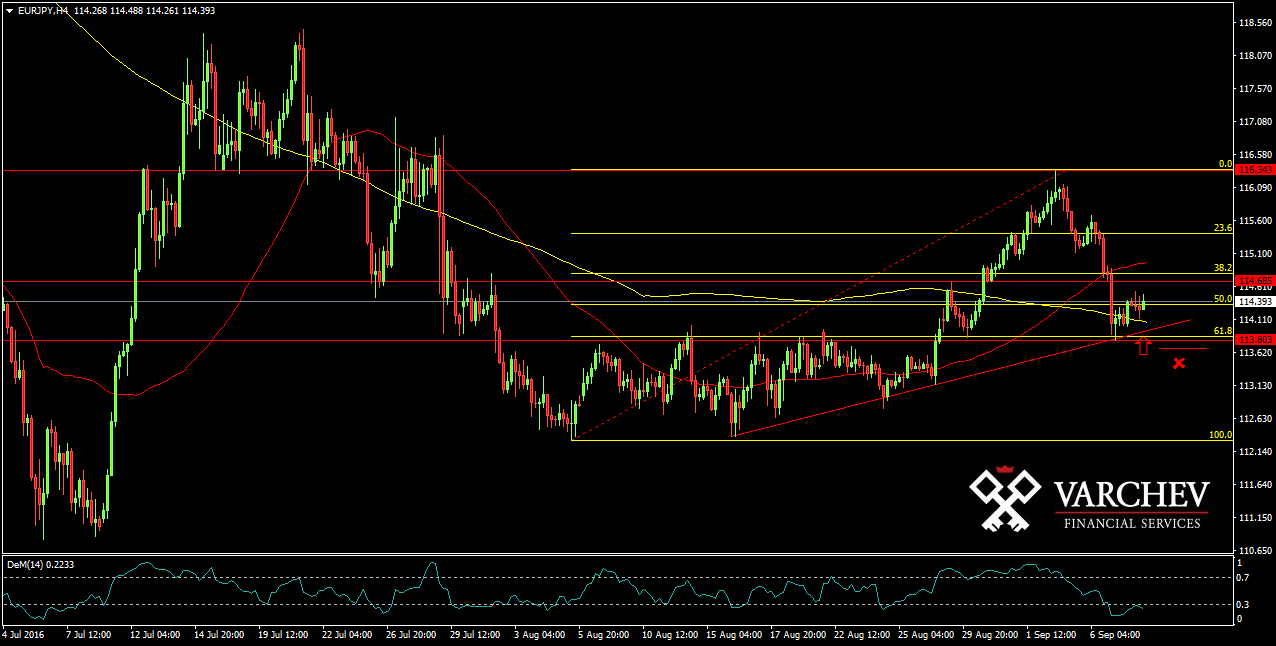
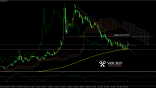
H4 Graph: Long Term short, Short term long
The price formed serious bottom around 112,300, after which started going up and reached horizontal resistance at 116.300/500. Correction down to Fib 61,8% of the previous leg up and holds above the horizontal and diagonal support
Price Action: Pin bar at levels of strong horizontal and diagonal support - Signal for possible up move and End of the correction.

Alternative scenario: If the price moves lower again below Fib Фибо 61,8% and below the horizontal and diagonal support, this will cancel the bullish view.
Technical Indicator:
DEM (14): In oversold zone.
Price for Entry long around: 114.200
SL 113.600
Jr. Trader - S. Fuchedzhiev
 Varchev Traders
 Read more:
RECCOMEND
WAS THIS POST USEFUL FOR YOU?
If you think, we can improve that section,
please comment. Your oppinion is imortant for us.
If you think, we can improve that section,
please comment. Your oppinion is imortant for us.

