

- Home
- >
- FX Daily Forecasts
- >
- EUR/JPY: Possible short after retest of horizontal and diagonal resistances

EUR/JPY: Possible short after retest of horizontal and diagonal resistances
Rating:

EUR/JPY:
Date: 13 February, 2017
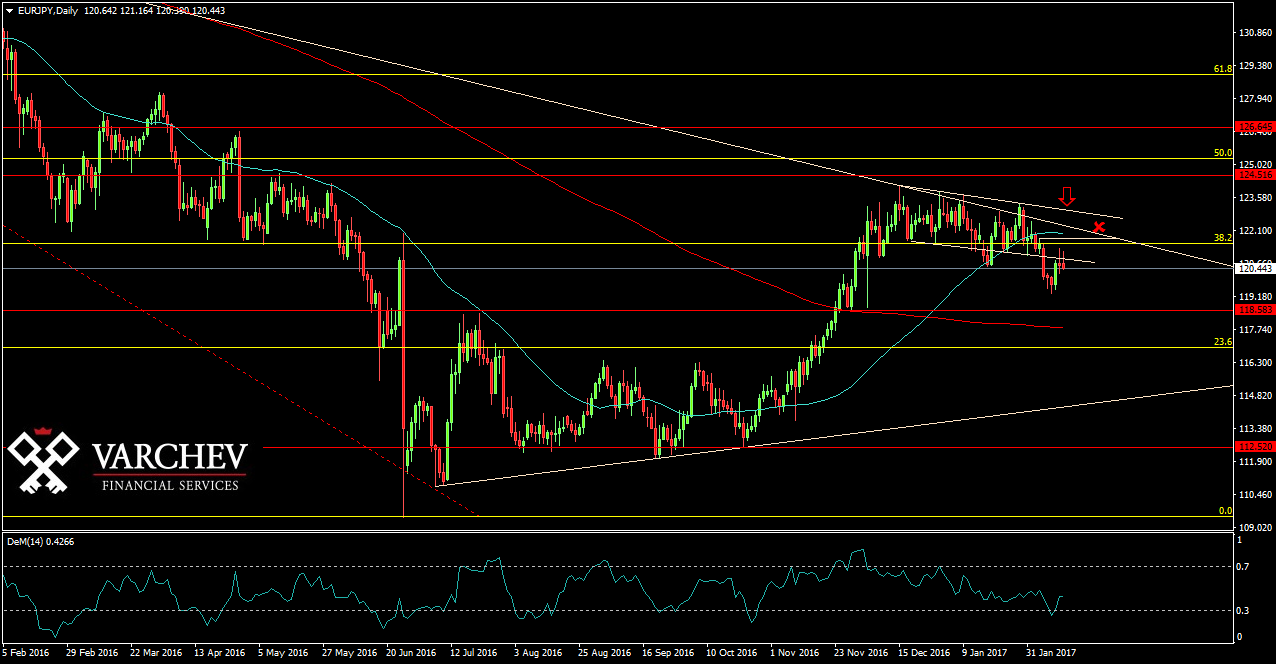
D1 Graph:
Price broke below the formation Flag, which has formed earlier and now is back to test the break point. Price remains below the horizontal and diagonal resistances and below Fibo 50% from the previous move lower. Price is also below 50 EMA.
Price Action: Doji bar at a strong horizontal and diagonal resistance levels - Possible signal for short.
DEM - Is near the oversold zone.
Alternative scenario: if the price continue to move higher and passes above the diagonal resistance and price level of 121.500, this will cancel the bearish view.
Price for Entry short around: 120.500
SL: 121.500
Trader - S. Fuchedzhiev
 Varchev Traders
 Read more:


RECCOMEND
WAS THIS POST USEFUL FOR YOU?
If you think, we can improve that section,
please comment. Your oppinion is imortant for us.
If you think, we can improve that section,
please comment. Your oppinion is imortant for us.

